1.1 Introduction
Today’s global economy is highly dependent on fossil fuels with oil being the most important feedstock. The scenario of depleting oil reserves therefore threatens the basis of most of our businesses and has a potentially huge impact on our daily life. At the same time conversion of fossil fuels into carbon dioxide is considered a big threat for our climate. These are the main reasons for the proposal to replace fossil fuels with renewable biomass and close global carbon cycles. This article takes a closer look at the probable consequences of this raw material change specifically for the chemical industry: what is the status, what are issues and what are the opportunities? It might also inspire young researchers to tackle some really important challenges that will arise in the future.
1.2 Raw Material Alternatives
In the beginning of industrialization coal was the most important raw material for the chemical industry, e.g., for the production of dyes. It was soon replaced by oil and later also by natural gas since easier logistics and lower prices made these more attractive. Today, supply with sustainable and affordable energy is one of the main challenges of mankind and this might trigger a third big change in the raw material supply for the chemical industry as well. If prices for fossil fuels rise significantly and permanently, for example due to limited availability or political initiatives to reduce greenhouse gas emissions [1], biomass could become the most attractive feedstock for the chemical industry in the future. However, there should be an awareness of alternative scenarios, e.g., using fossils only for chemicals but not for energy, or the usage of carbon dioxide for chemicals.
The energy industry and the transportation sector are by far the most important consumers of fossil fuels: about 10 billion tons (calculated as oil equivalents) are used for this purpose with roughly 4 billion tons of this being crude oil (Figure 1.11, [2]). Only 3% of all fossil fuels are used in the chemical industry. However, compared to the energy industry, the chemical industry is much more restricted in terms of feedstock. Whereas energy can generally be converted from a big variety of sources, most chemicals depend on the carbon content of the corresponding raw material (Figure 1.2). On the one hand, carbon dioxide (and carbonates) is the only large carbon-containing feedstock that is irrelevant for the energy industry. On the other hand, a lot of energy is required for its chemical use due to thermodynamical reasons [3,4]. If the required energy comes from fossil fuels it is more reasonable to use the fossil fuels directly for chemical production as this leads to an overall lower consumption. However, when non-fossil-based energy is available, carbon dioxide can be a very attractive and sustainable carbon source for chemicals.
Green plants can convert carbon dioxide into biomass using the energy of the sun. Biomass then contains enough energy for both energy production and chemical use; when converted back to carbon dioxide no additional greenhouse gas is produced.
But let us first have a look at today’s chemical industry which is mainly based on fossil fuels. More than 70% of all chemicals in Germany are based on crude oil; the rest breaks up into equal portions of natural gas and renewables. Coal as a chemical feedstock is negligible in Germany (Figure 1.3, [5,6]). The most important process to convert a distillation fraction of crude oil called naphtha into the first members of chemical value-added chains is steam cracking (Figure 1.4). At high temperatures and with the dilution of steam, the alkanes of naphtha crack into lower olefins like ethylene and propylene and also form aromatics, namely benzene and toluene. Other processes for the production of olefins and aromatics are fluid catalytic cracking (FCC) and reforming. Both processes are carried out in refineries and deliver the mentioned chemicals only as a by-product. However, due to their enormous size they are an important source. Ethane as a component of natural gas is converted by steam cracking into ethylene; in this case virtually no higher olefins or aromatics are formed. Methane, being the main component of natural gas, is converted into synthesis gas (syngas), e.g., by steam reforming. Synthesis gas is a mixture of carbon monoxide and hydrogen and predominantly converted into methanol and ammonia. Another source for synthesis gas is the gasification of coal. The old calcium carbide process for transforming coal into acetylene is currently experiencing a revival for polyvinyl chloride production in China. Coke production for the steel industry delivers benzene (hydrogenated coke-based benzene, HCBB) as a by-product.
The previously described conventional entries into chemical value-added chains are endangered by the finite nature of fossil fuel supply. For example, if the availability of oil declines significantly, the olefins and aromatics demand cannot be satisfied. Rather new technologies, like methanol-to-olefins (MTO) or methanol-to-propylene (MTP), could help by delivering olefins from synthesis gas (via methanol); interestingly, synthesis gas is also available from biomass. No industrially relevant alternative process for aromatics is in use today.
The conventional reserves, i.e., known deposits that can be obtained with today’s technologies at competitive costs, might run short in about 40 years for oil and 60 years for gas at the current level of energy use [7,8]. Non-conventional resources, i.e., assumed deposits that might be available with so far unknown technologies, could be significantly larger (e.g., methane hydrates in the oceans) (Figure 1.5). The enhancements in raw material production technologies and the discovery of new deposits have led to a nearly constant static range for oil and other feedstock in the past (Figure 1.6, [7,8]). A prominent recent example for a technological breakthrough is shale gas production in the USA. In any case, there will be enough coal for a very long time.
At first glance biomass appears to be infinite compared to fossil fuels. About 160 billion tons of biomass are growing every year, two thirds of which grow ashore. Global stocks are in the same order of magnitude as fossil resources (Figure 1.7, [9]). However, a closer examination shows that only a small part of that biomass can be made available for energy purposes. Optimistic scenarios suggest that 30 to 70% of the worldwide energy demand could be satisfied with biomass in 2050 (Figure 1.8, [2,10]).
Another issue with fossil fuels is the geographically uneven distribution. About 70% of all known conventional reserves of oil and gas are concentrated in a rather small area of the planet. This leads to a high dependence of the rest of the world on the countries of this area (Figure 1.9, [7,8]). Biomass in comparison can be potentially produced in many different regions of the world in a reasonable manner (Figure 1.10, [10]).
1.3 Existing Businesses with Renewables
After having gained an idea of the current chemical feedstock use and the supply situation, let us have a look into the current use of renewables in the chemical industry. Roughly half of these renewables are fats and oils. Sugar and starch as well as cellulose also play a significant role (Figure 1.11, [5]). The three most important oils are palm oil, soybean oil and rapeseed oil of which 73% are used for food (Figures 1.12 and 1.13, [5]). The chemical industry transforms another 11% into biofuels and only a minor part into other (oleo)chemicals [11]. Figure 1.14 shows a repertory of chemical value-added chains based on fats and oils. A lot of the derived chemicals end up in personal care products, cosmetics, surfactants or lubricants. A chemically interesting example is the production of sebacic acid, e.g., for nylon 6,10, from castor oil. Saponification gives ricinoleic acid which is isomerized and then oxidatively cleaved (Figure 1.15). However, much more important is the transesterification of palm or rapeseed oil to fatty acid methyl esters (FAME), so-called “biodiesel first generation” (Figure 1.16). Sodium methoxide acts as a catalyst in the reaction with (usually non-bio-based) methanol; a by-product of this reaction is glycerol. If the oils are hydrogenated instead, so-called “biodiesel second generation” is obtained; it is more similar to conventional diesel.
The production of glycerol with “biodiesel first generation” has led to a significant price decline for glycerol (Figure 1.17, [12]). Therefore, glycerol has been considered an interesting renewable raw material for many chemicals (Figure 1.18, [13]). For example, BASF developed a very efficient hydrogenation process for mono propylene glycol (Figure 1.19). Due to past subsidization, large over-capacities for biodiesel production have been installed worldwide, but their profitability has often not been sustainable (Figure 1.20). Sucrose, as well as starch-derived glucose, is a suitable feedstock for many important chemicals (Figure 1.21). In most cases fermentation is the first step to convert sugars into useful chemicals; chemical transformations are still much less important. The main challenge is the high degree of functionalization of sugars compared to the target chemical products. Highly efficient methods for defunctionalization have only been a niche business in chemical research in the past. Some interesting examples are shown in Figures 1.22 and 1.23: citric acid, itaconic acid and (iso)butanol are produced by fermentation, and isosorbide is chemically accessible. The most important fermentation of carbohydrates to chemicals is the bioethanol production for motor fuels. 98% of all ethanol worldwide is produced by fermentation. Countries with sugar cane cultivation like Brazil have a competitive advantage since they do not have to convert starch from corn or wheat into sugar as a first step (Figure 1.24). Ethanol may not only be a fuel but also a raw material for other downstream chemicals (Figure 1.25). For example, a BASF process (development stage) for the production of acetic acid is shown (Figure 1.26): the oxidation with oxygen works with high selectivity at high conversion. Although the global bioethanol production is bigger than the biodiesel production, it is still negligible compared to global gasoline consumption (less than 5%; see Figure 1.27).
1.4 Existing Businesses with Renewables: Issues
As long as there are fossil fuels available at a reasonable price, the most important reason to produce bio-based fuels, e.g., bioethanol or biodiesel for mobility applications, is the reduction of greenhouse gas emissions. However, today’s biofuels are by far not carbon-neutral: not only the fuel for agricultural machinery is relevant, especially fertilizer and the processing to make the actual biofuel lead to significant greenhouse gas emissions. In the end, there are savings of roughly one to two thirds compared to the emissions with fossil fuels. The picture becomes much worse when areas of unspoiled nature are converted into agricultural land for biofuel production (Figure 1.28). The deforestation leads to significant carbon dioxide emissions and an increase in methane and nitrous oxide emissions [14-16]. The worst examples are the sugar cane and soybean productions in South America and the palm oil production in South East Asia. For example, Indonesia has become the world’s third-largest emitter of greenhouse gases due to the deforestation necessary for the production of palm oil [17].
Obviously, general ethical issues are raised when food plants are used for anything else but nutrition. This problem became apparent to everybody when biofuel production led to an increase in food prices and subsequent disturbances in third-world countries with people suffering from malnourishment. An example for such a mechanism is the establishment of a floor price for palm oil in the beginning of 2007: when palm oil prices drop below a certain price compared to crude oil, biodiesel production begins and keeps palm oil prices high (Figure 1.29).
1.5 The Use of Biomass
A reasonable way to avoid the aforementioned issues with the use of renewables is the utilization of the main components of plants, biomass, and the avoidance of the usage of small edible fractions. Biomass mainly consists of cellulose, hemicelluloses and lignin (Figure 1.30). Cellulose is based on sugars with six carbons, hemicelluloses consist of sugars with five carbons, lignin is a condensed polyaromatic structure that represents the starting material for geological lignite and hard coal formation. The easiest way to feed biomass into chemical value-added chains is to gasify it into synthesis gas and use processes like MTO to obtain ethylene and propylene or Fischer-Tropsch (FT) to produce “biodiesel third generation.” However, this procedure destroys a lot of valuable chemical bonds and adds unwanted oxygen. In order to get the desired products, bonds have to be rebuilt and oxygen has to be removed in the form of water (Figure 1.31). Overall, a lot of—unnecessary—energy is required, which makes these processes less economically favorable. A generally more attractive way is the so-called structural use of renewables: the synthesis work of nature is conserved in the chemical products (Figure 1.32 [18]). A good example for structural use is the aforementioned synthesis of mono propylene glycol from glycerol by selective defunctionalization: a hypothetical process via synthesis gas has significantly more steps and is much more energy intensive and thus economically and ecologically unattractive (Figure 1.33).
In order to enable the structural use of biomass, a biorefinery that separates the main components cellulose, hemicelluloses and lignin is required. In analogy to a petroleum refinery, a biorefinery is defined as “a facility that integrates biomass conversion processes and equipment to produce fuels, power and chemicals from biomass.”[19]
A common concept is the separation of cellulose and subsequent enzymatic hydrolysis and fermentation to cellulosic bioethanol as fuel (Figure 1.34); the competition with food production could be minimized since agricultural waste and non-food sources could be used. The analogous fermentation of xylose from hemicelluloses is still under development. Xylose could also be the starting point for several interesting value-added chains (Figure 1.35); the current production of furfuryl alcohol and xylitol (sweetener) are examples (Figure 1.36).
1.6 Outlook/Conclusions
The energy industry is the most important driver for the use of renewables. Finite resources of fossil fuels, uneven geographical distribution and climate issues related with fossils are the most important drivers for the use of renewables. The current chemical use (including fuels) of renewables is basically limited to minor components of plants that are also important for nutrition. Therefore, lignocellulosic biomass will become the most important renewable feedstock in the future. Biorefineries are required to feed biomass into value-added chains for fuels and chemicals. Structural use should be given preference over gasification approaches for the production of chemicals. Some potentially very useful “dream reactions” as examples for structural use are shown in Figures 1.37 and 1.38.
Bibliography
[1] IPCC (International Panel Climate Change). Climate Change., 2007
[2] IEA (International Energy Agency). Key World Energy Statistics., 2009
[3] M. Aresta, A. Dibenedetto. Utilisation of CO Dalton Transactions (2007): 2975-2992.
[4] T. Sakakura, J.-C. Choi, JC. C.. Transformation of Carbon Dioxide Chemical Reviews 107: 2365-2387 (2007): 2365-2387.
[5] FNR (Fachagentur Nachwachsende Rohstoffe). Nachwachsende Rohstoffe in der Industrie., 2010
[6] VCI (Verband Industrie). Chemie Report., 2010
[7] BGR (Bundesanstalt Geowissenschaften und Rohstoffe). Energieroh- stoffe., 2009
[8] BP (British Petroleum). Statistical Review of World Energy., 2009
[9] H. Schöne, M. Rüsch. Biogene Kraftstoffe: Potentiale und Grenzen Chemie Ingenieur Technik Vol. 81: 901-908 (2009): 901-908.
[10] IFEU (Institut Energie- und Umweltforschung Heidelberg GmbH). Nachwachsende Rohstoffe für die Chemische Industrie: Optionen und Potentiale für die Zukunft., 2006
[11] T. Mielke () Global Outlook for Oilseeds & Products for the next 10 Years.
[12] Europe Spot. Europe Spot Refined FD NWE; prices averaged per year. .
[13] M. Pagliaro, R. Ciriminna, R. C., Kimura R., K. R.. Von Glycerin zu höherwertigen Produkten Angewandte Chemie International Edition Vol. 119: 4516-4522 (2007): 4516-4522.
[14] IFEU (Institut Energie- und Umweltforschung Heidelberg GmbH). Greenhouse Gas Balances for the German Biofuels Legislation., 2007
[15] EPA (Environmental Protection Agency). Lifecycle Analysis of Greenhouse Gas Emissions from Renewable Fuels., 2009
[16] Automotive R&D) concawe, for EUCAR (European Council, f. E.(.C.. Well-to-Wheels Analysis of Future Automotive Fuels and Powertrains in the European Context.., 2007
[17] World Bank, DFID (Department International Development). Executive Summary: Indonesia and Climate Change., 2007
[18] A. Corma, S. Iborra, S. I.. Chemical Reviews 107: 2411 (2007): 2411.
[19]
1.7 Figures
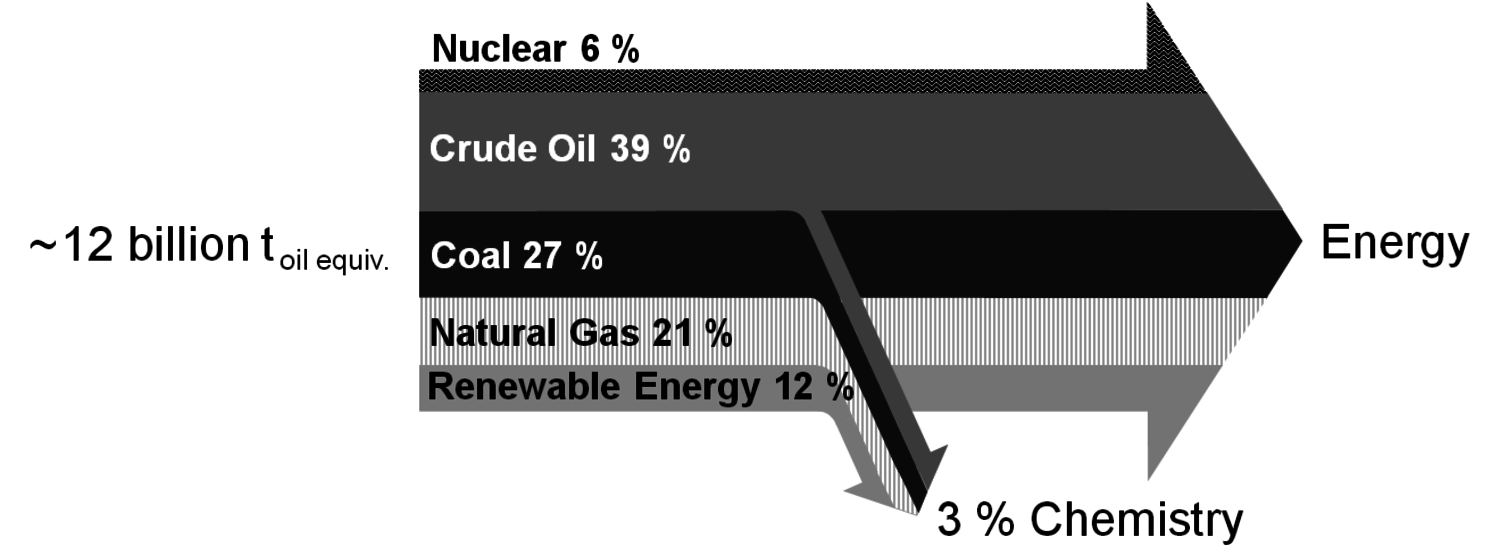
Fig. 1.1: Global Energy Demand
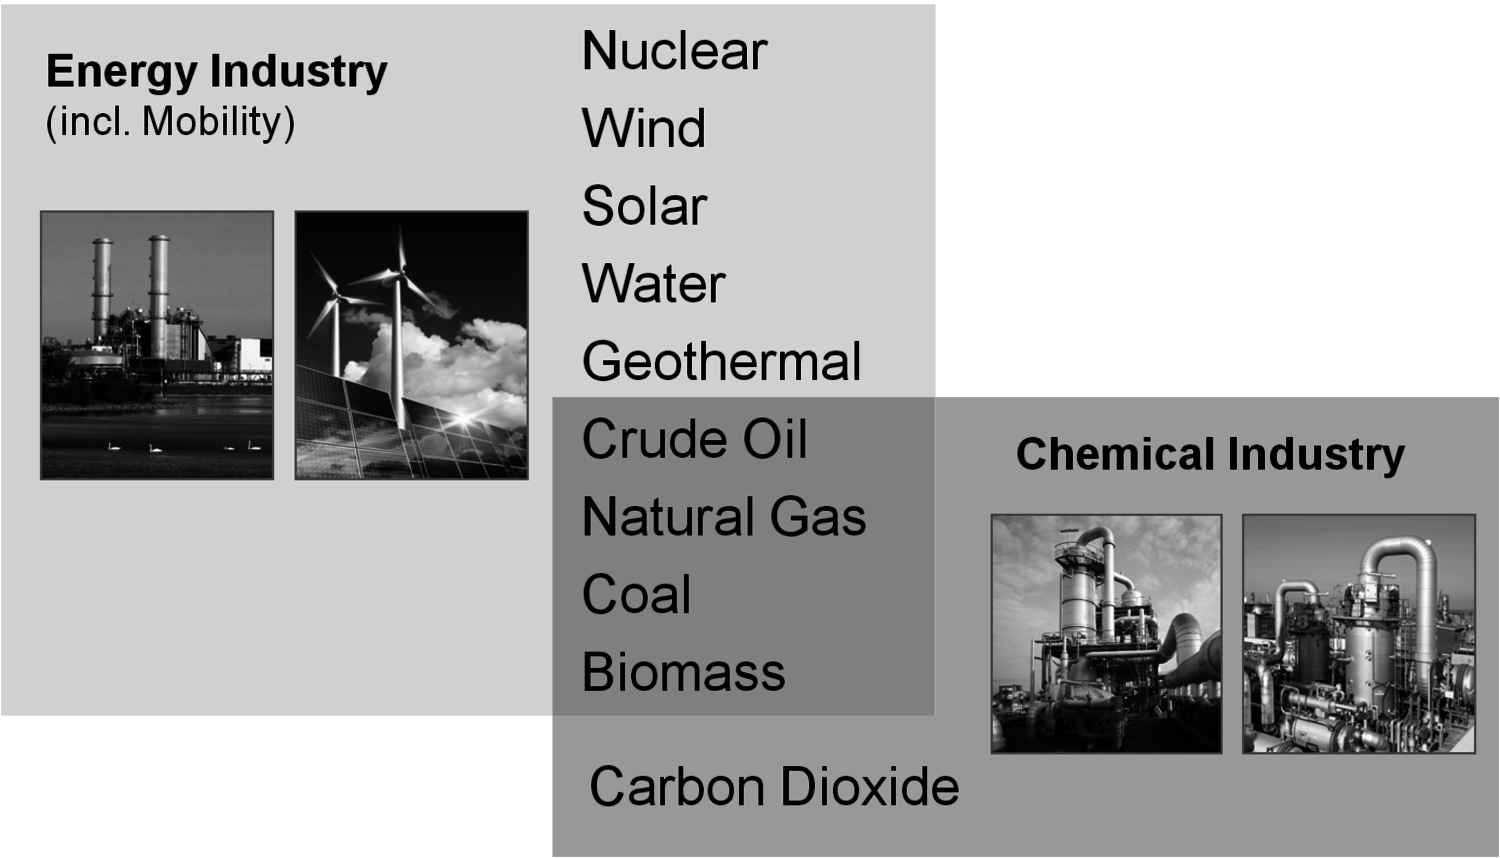
Fig. 1.2: Energy versus Chemical Industry
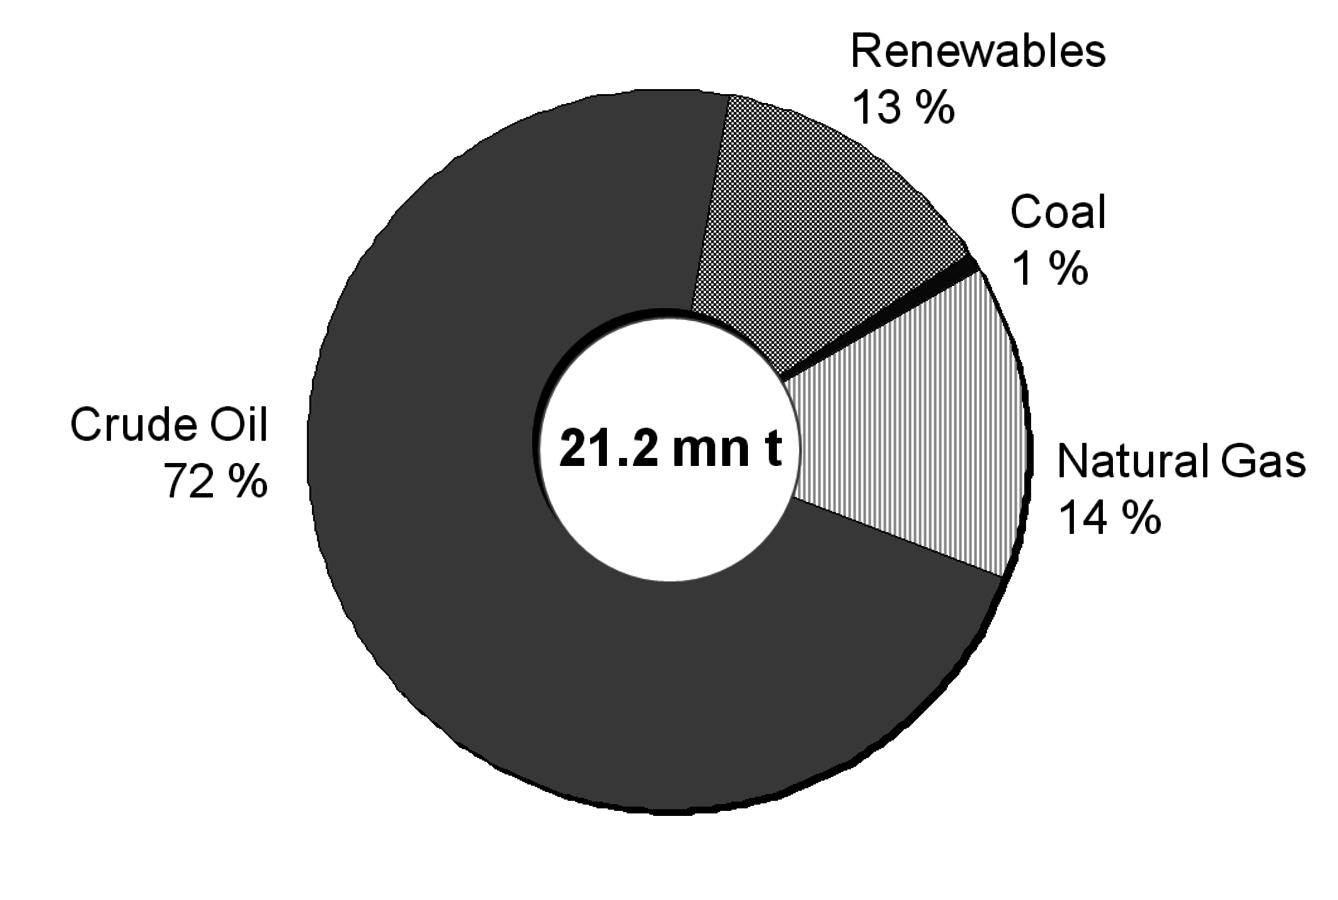
Fig. 1.3: Feedstock Usage in German Chemical Industry
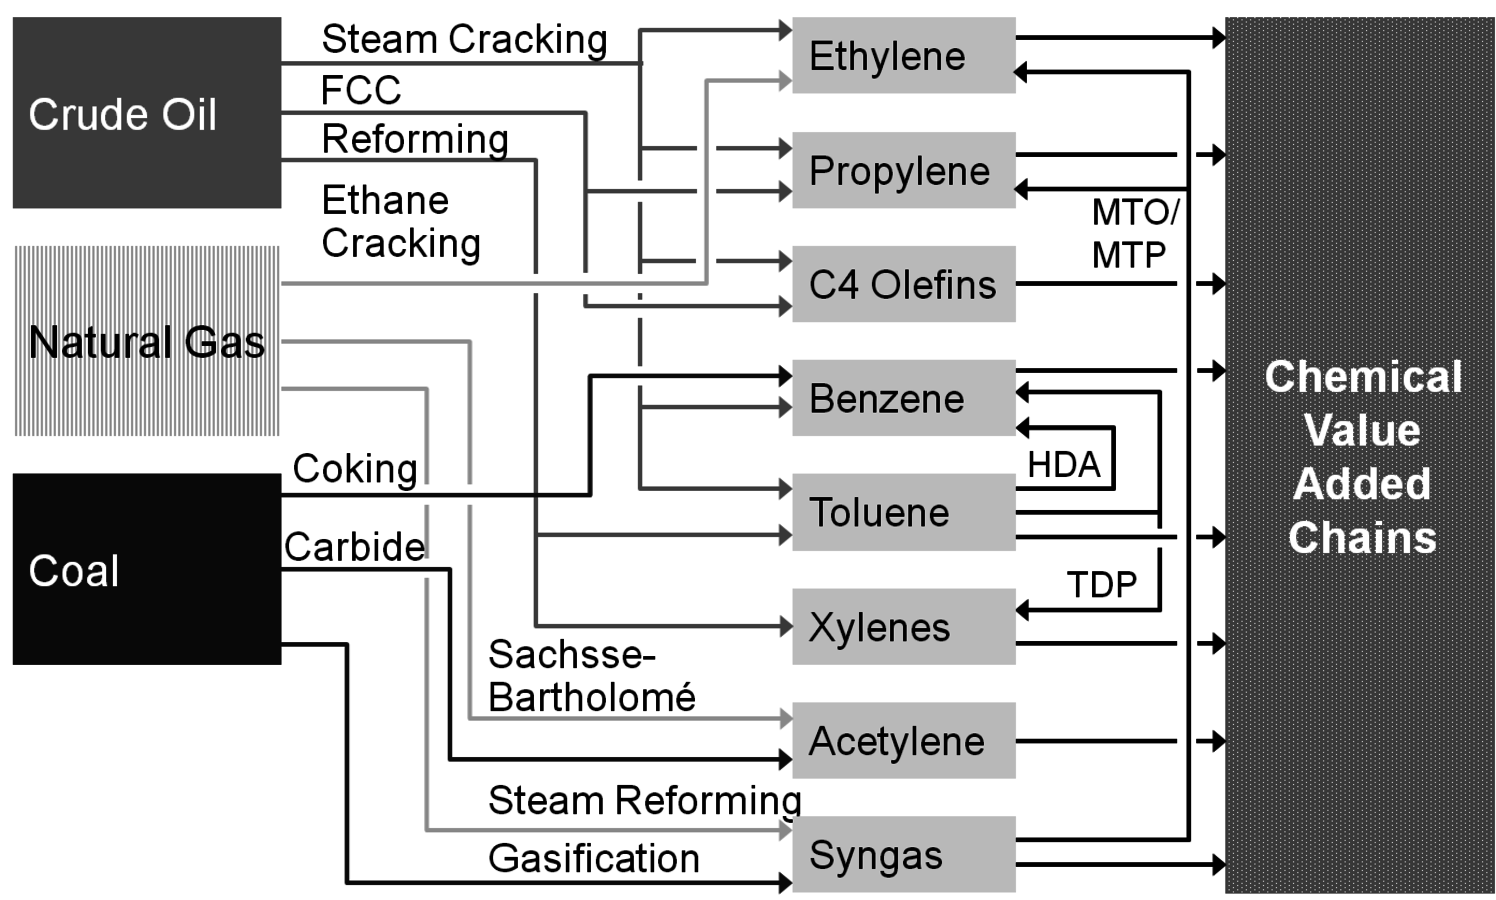
Fig. 1.4: Chemical Value-Added Chains: Fossils
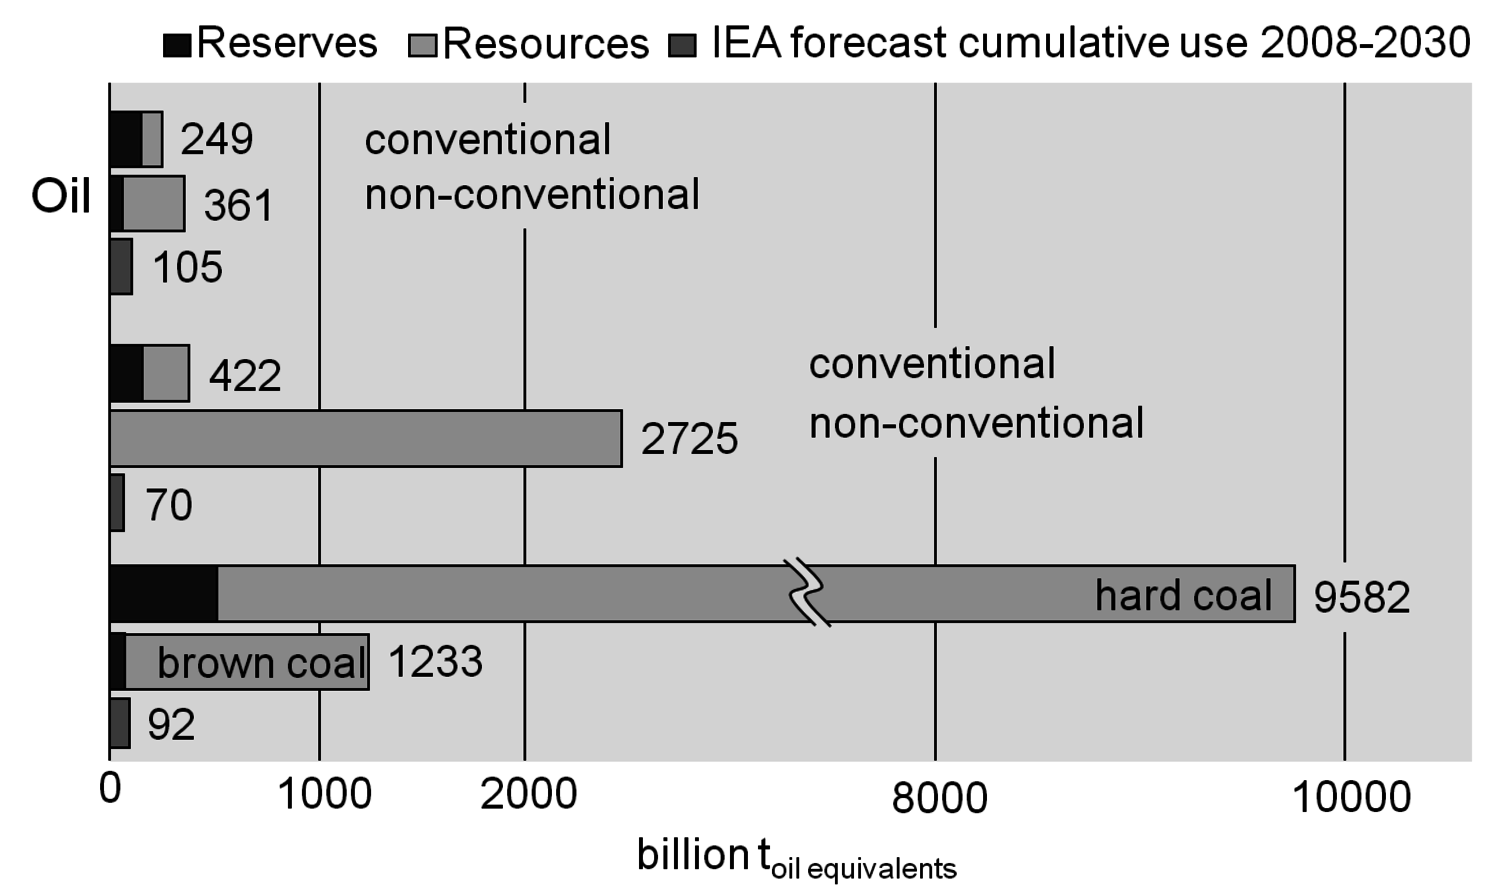
Fig. 1.5: Limited Reserves & Resources for Fossil Fuels
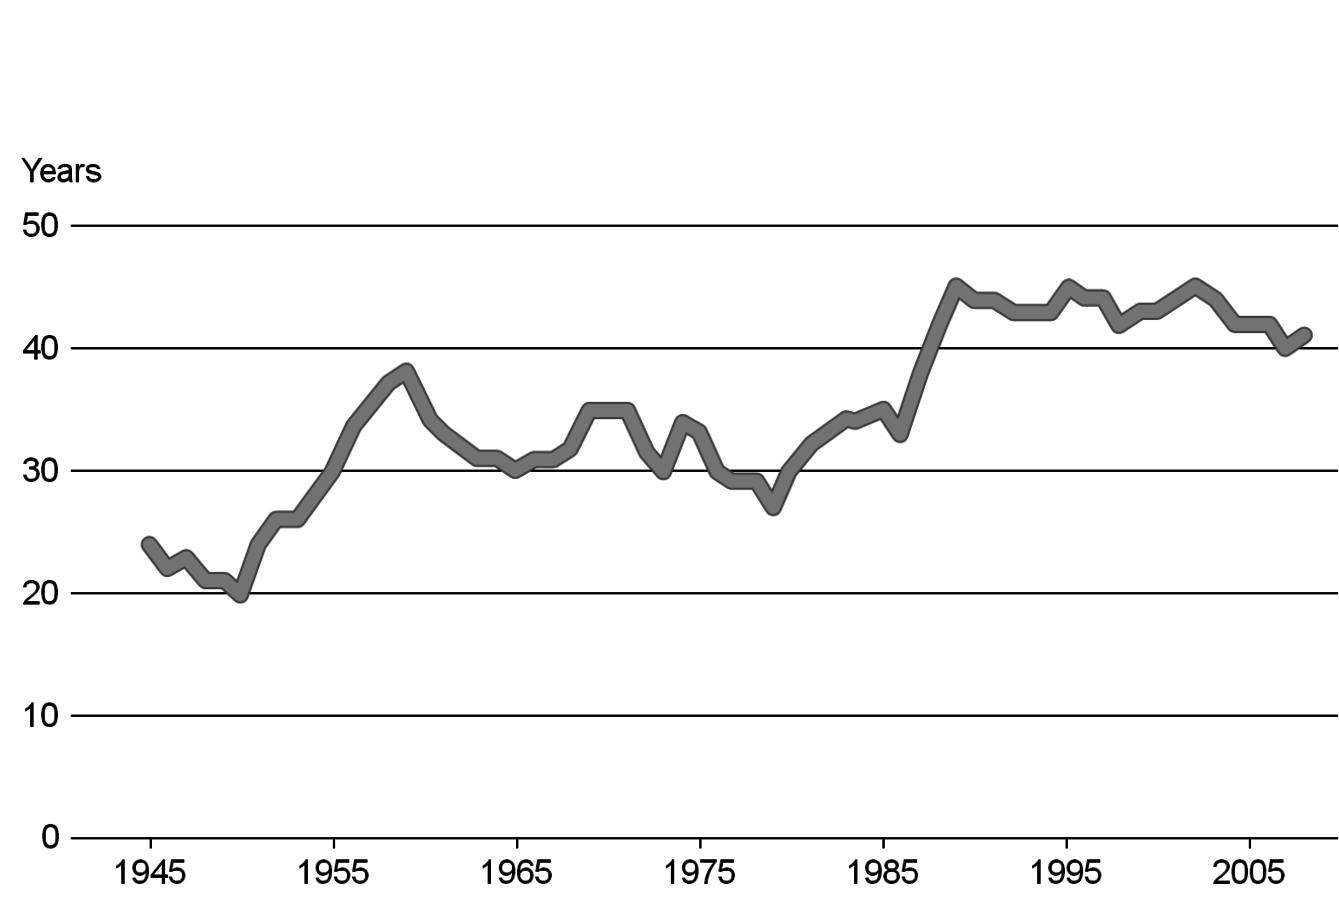
Fig. 1.6: Static Range of Oil
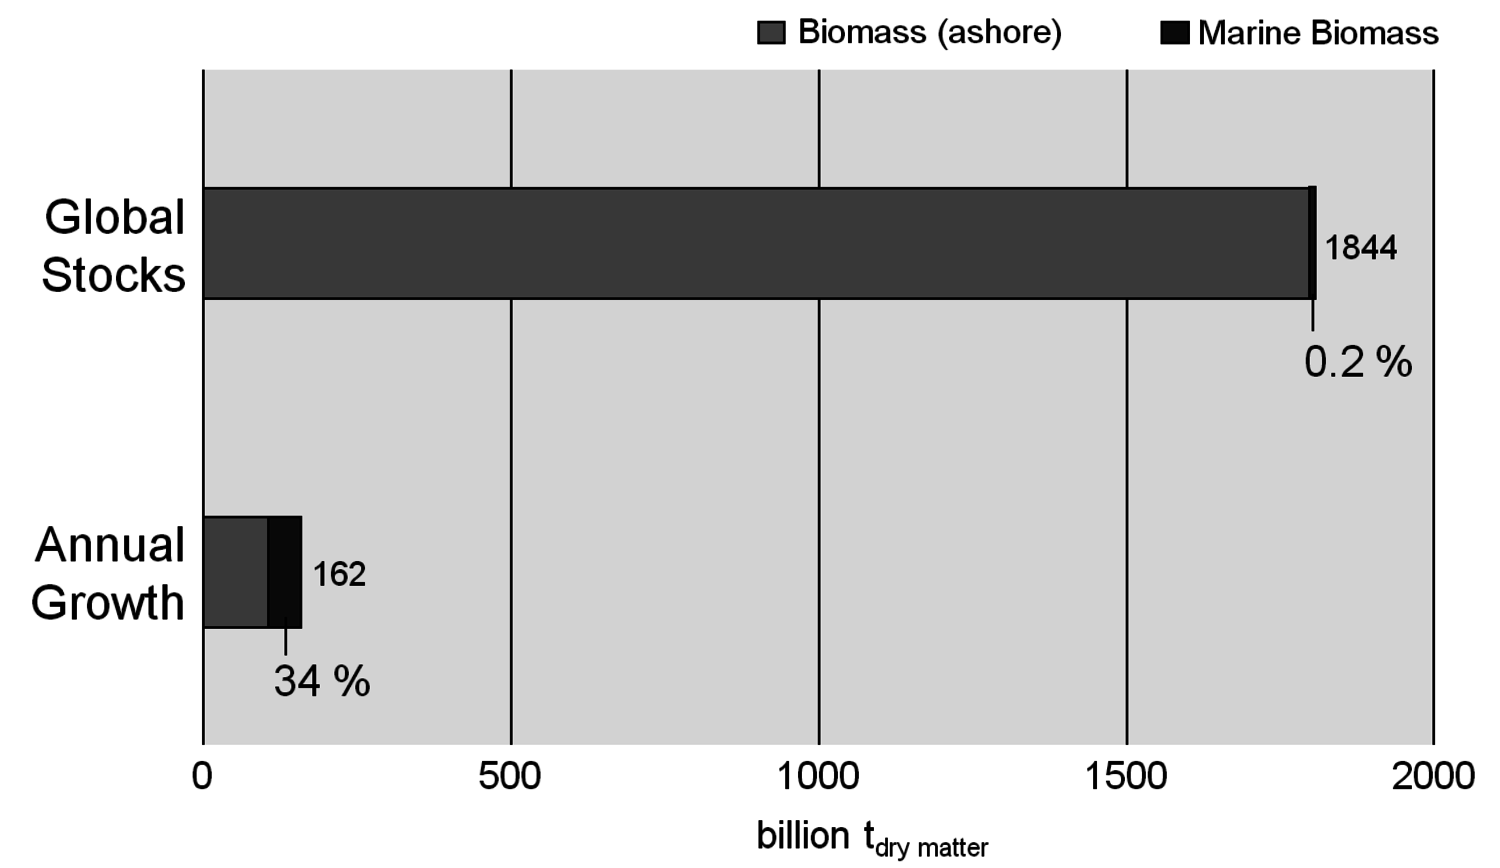
Fig. 1.7: “Unlimited” Reserves of Biomass
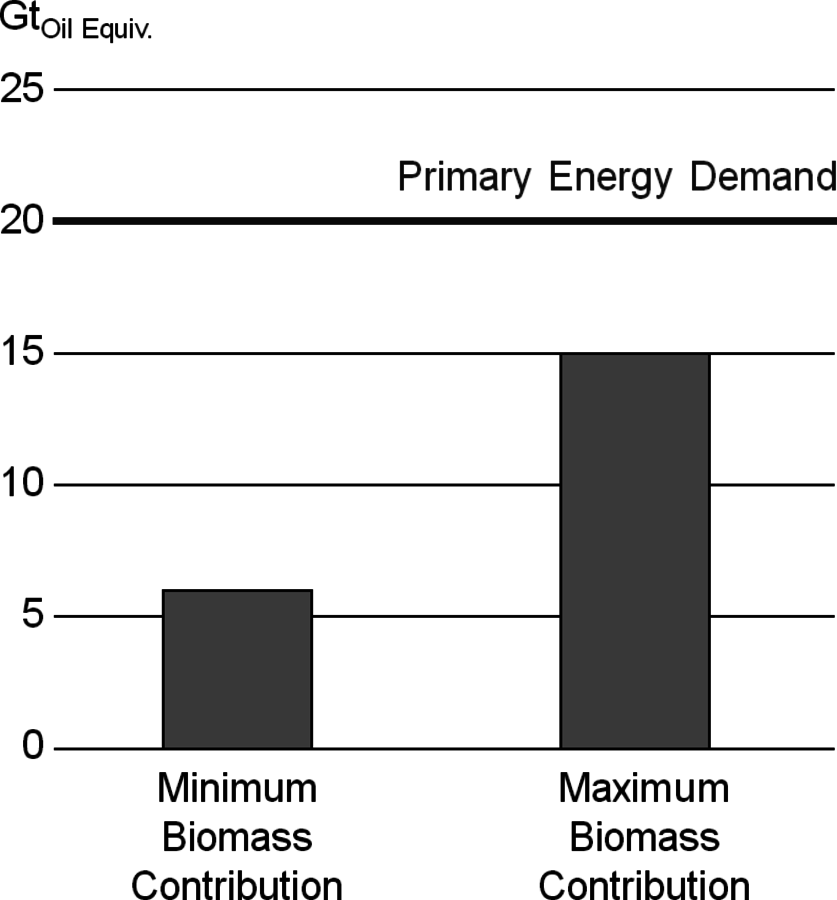
Fig. 1.8: Future Scenario for Energy 2050
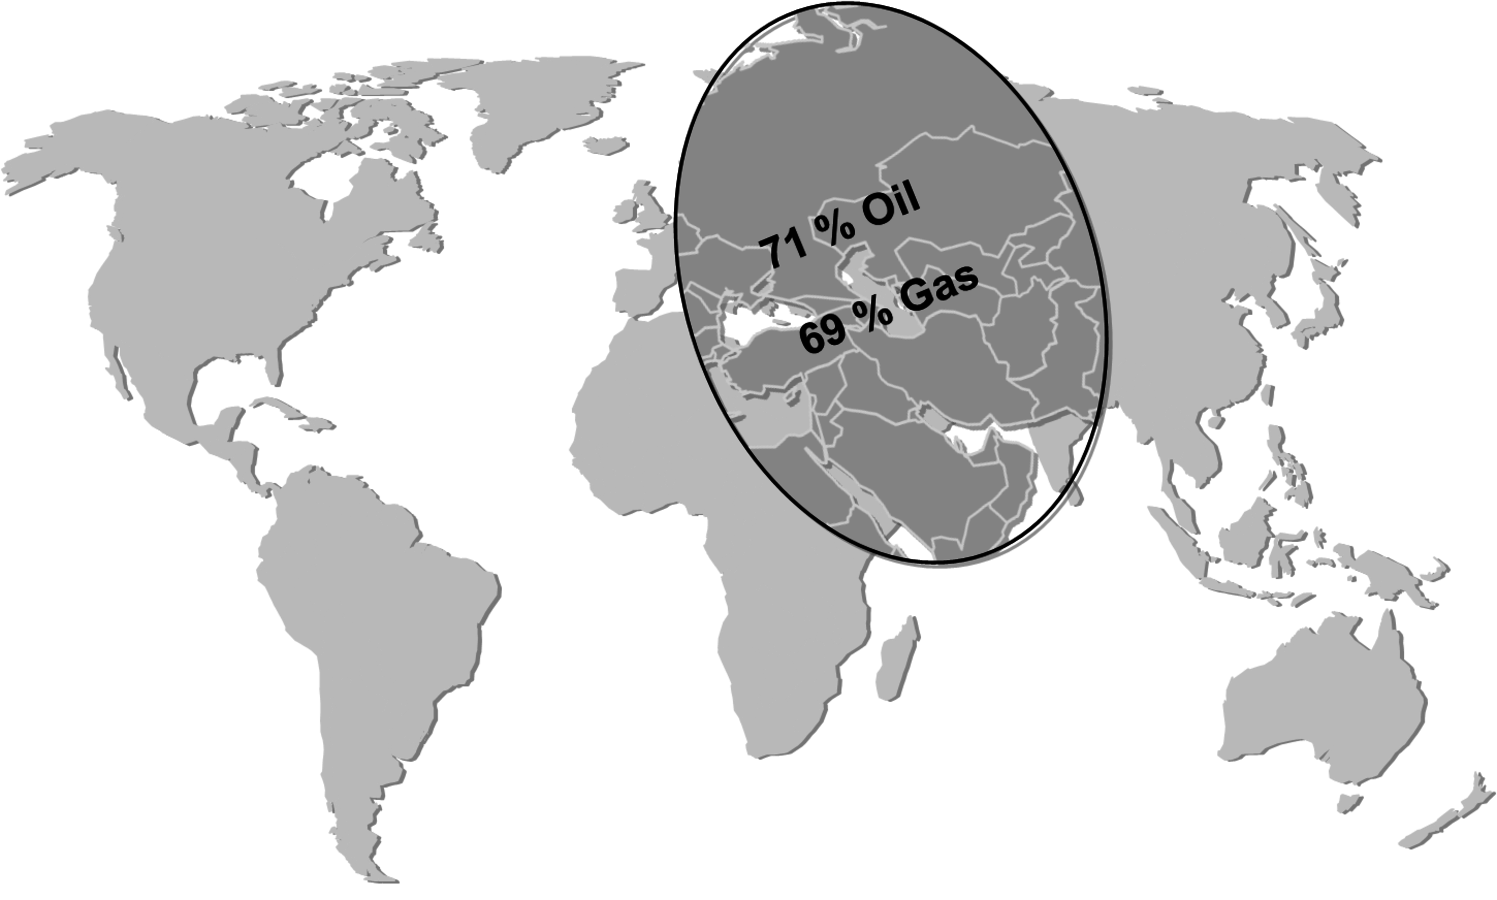
Fig. 1.9: “Strategic Ellipse” of Conventional Reserves
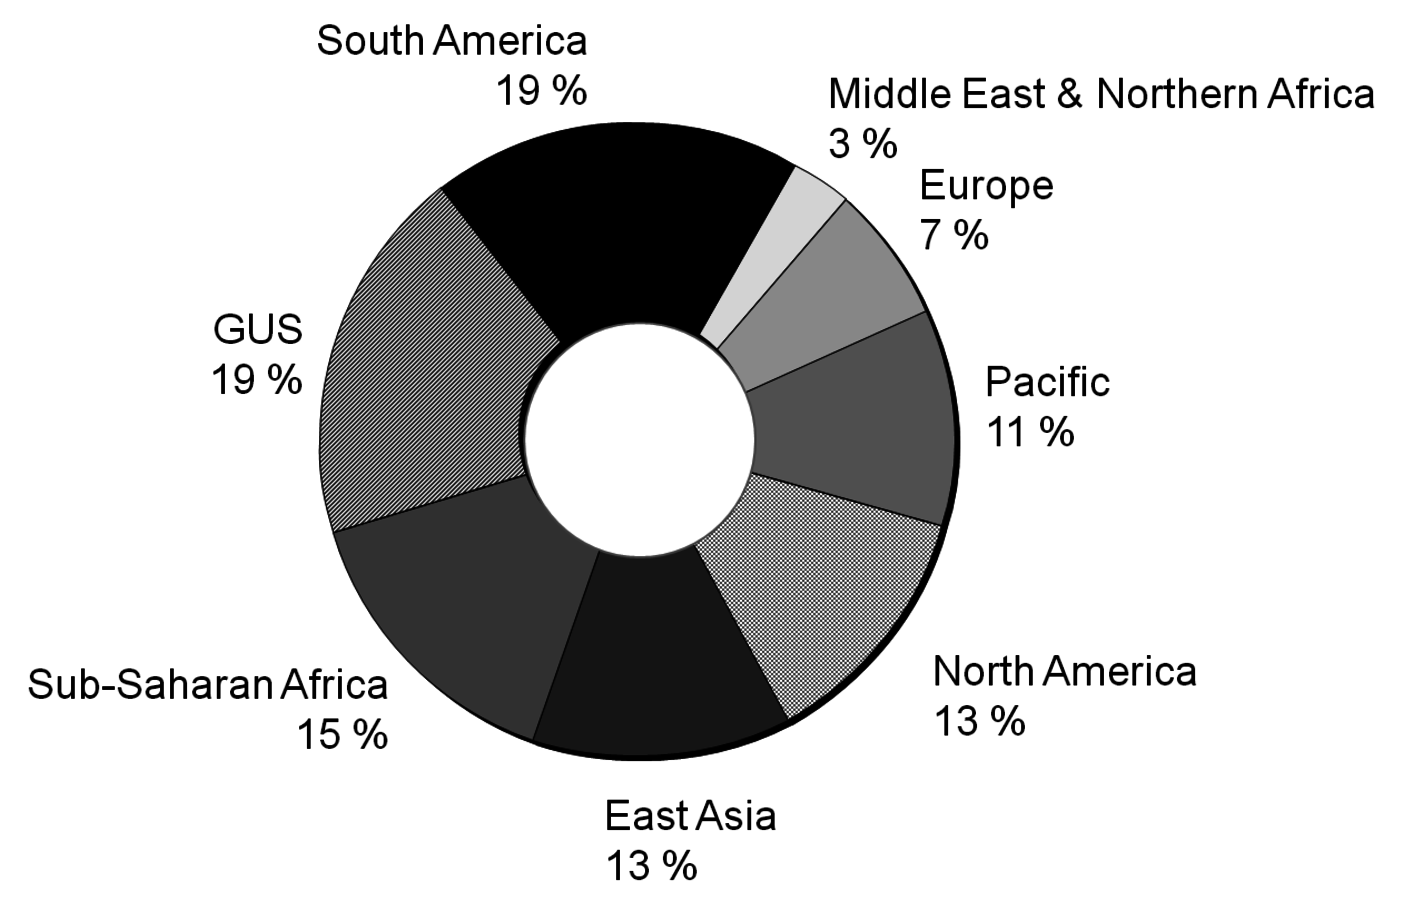
Fig. 1.10: Biomass Potential by Region 2050
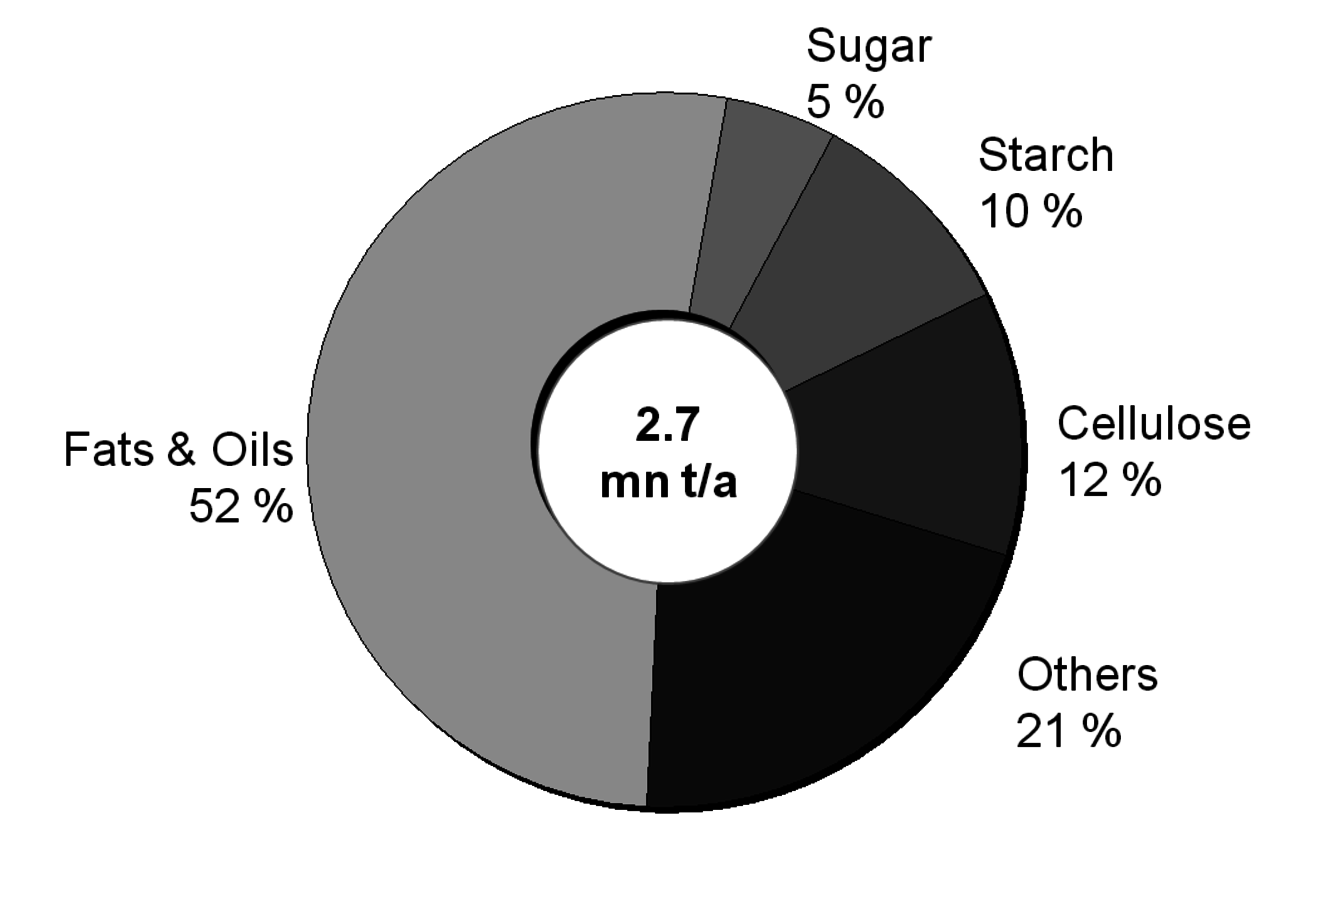
Fig. 1.11: Renewable Feedstock Usage in German Chemical Industry. Others: 21%
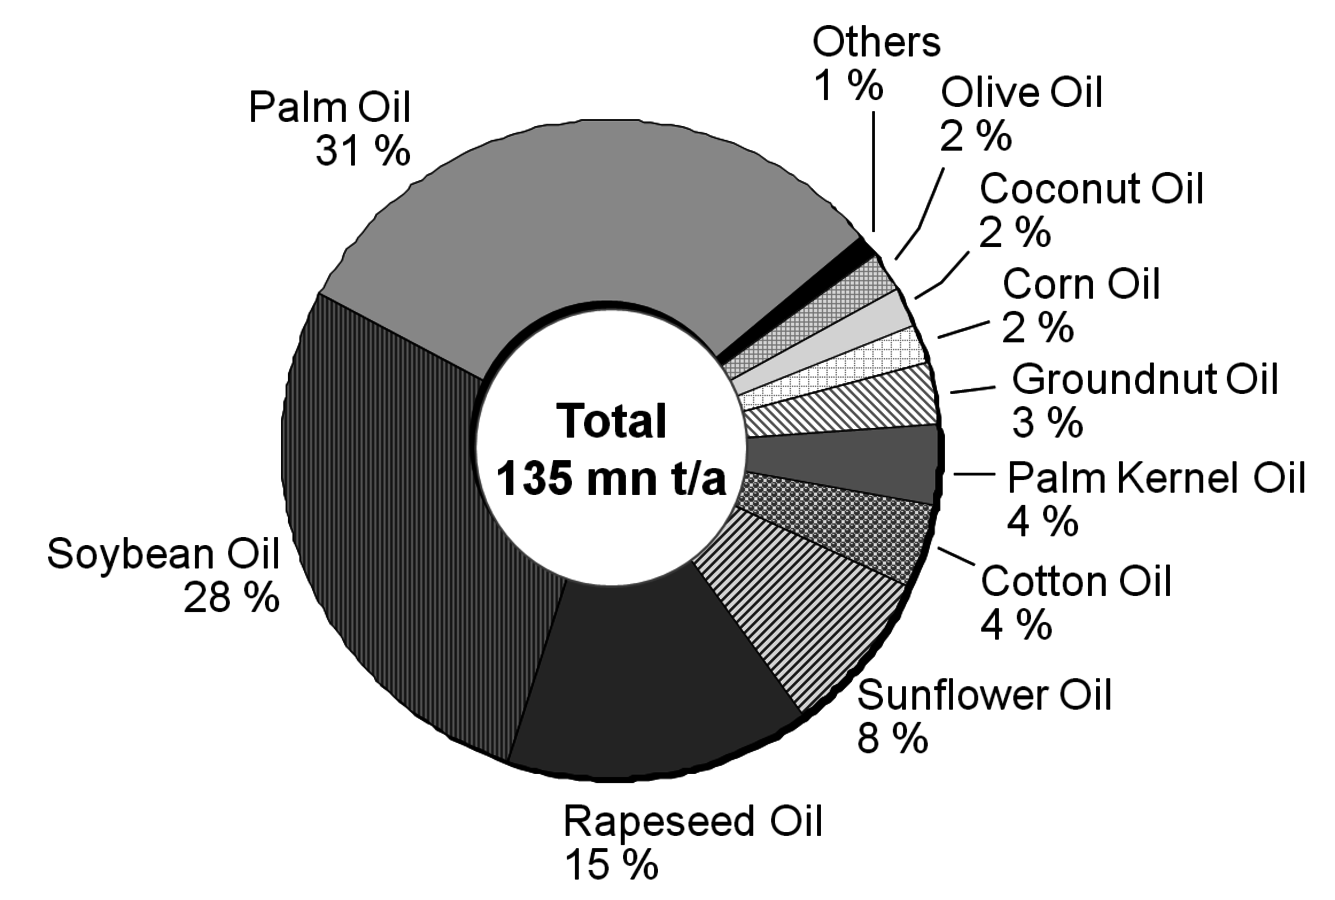
Fig. 1.12: Global Market Size for Oils
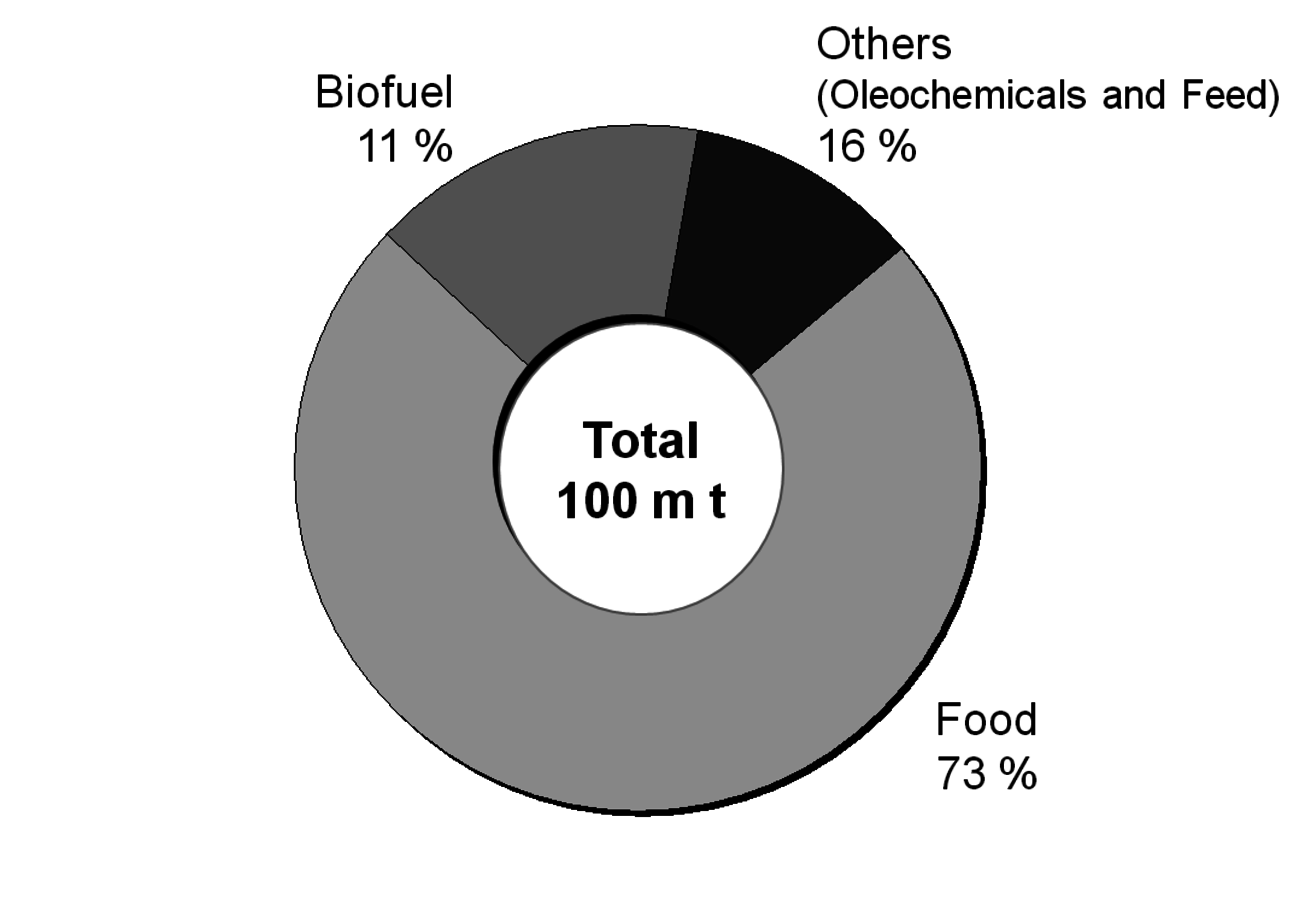
Fig. 1.13: Three Major Oils by Application
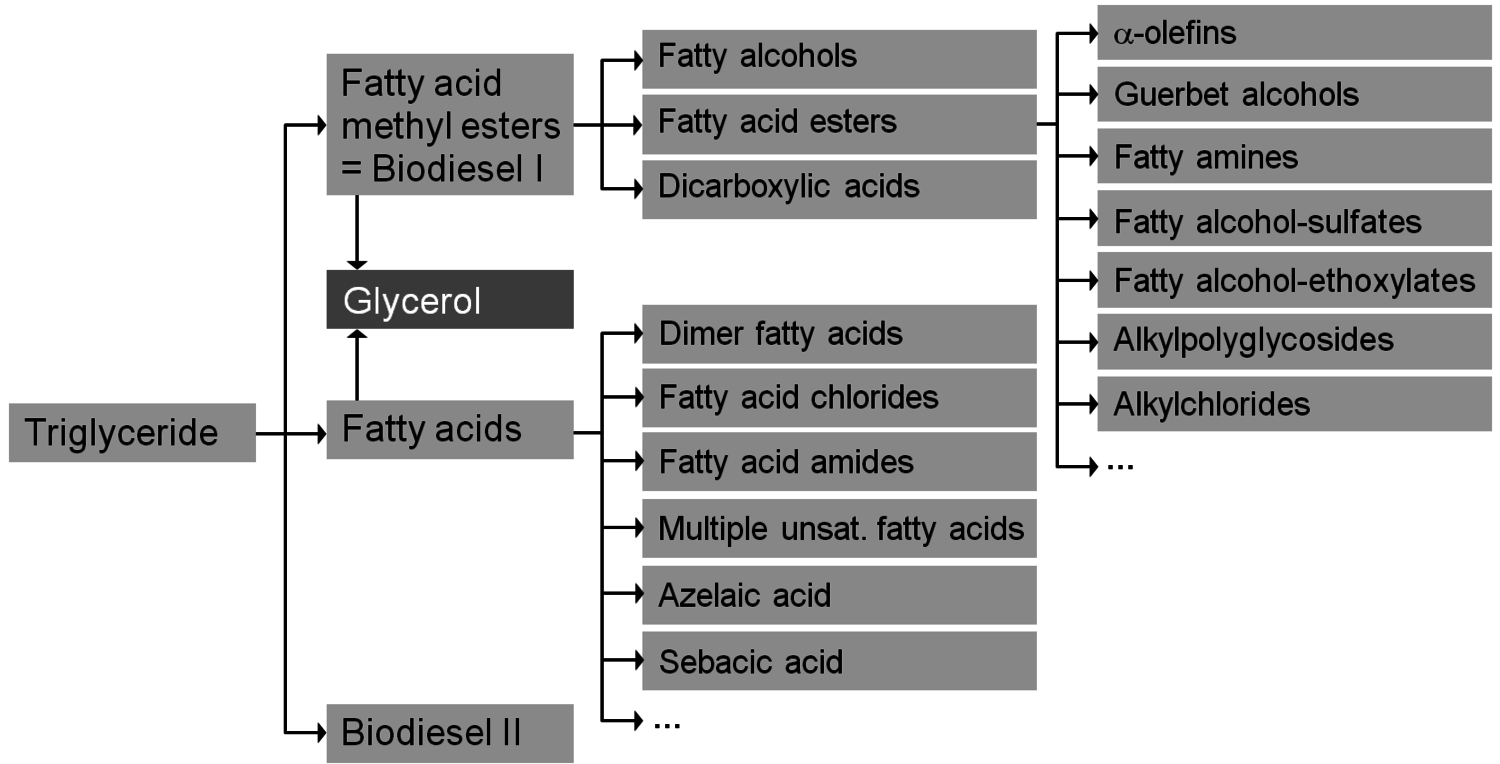
Fig. 1.14: Chemical Value-Added Chains: Fats & Oils
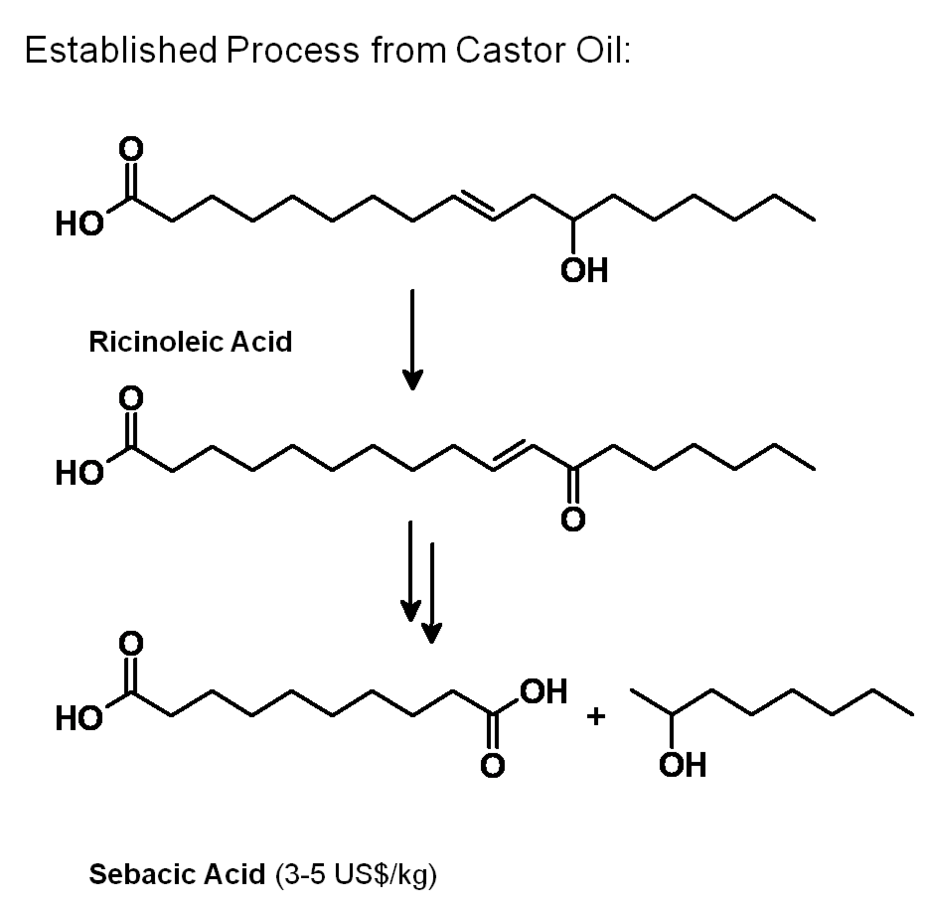
Fig. 1.15: Sebacic Acid from Castor Oil
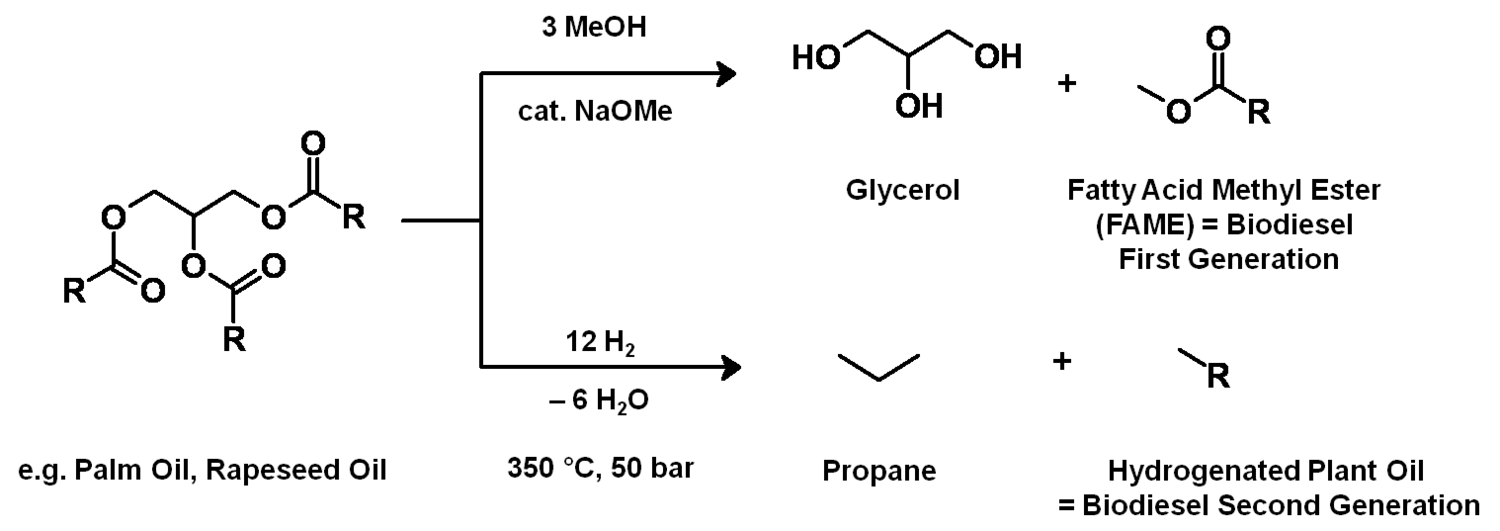
Fig. 1.16: Biodiesel First and Second Generation
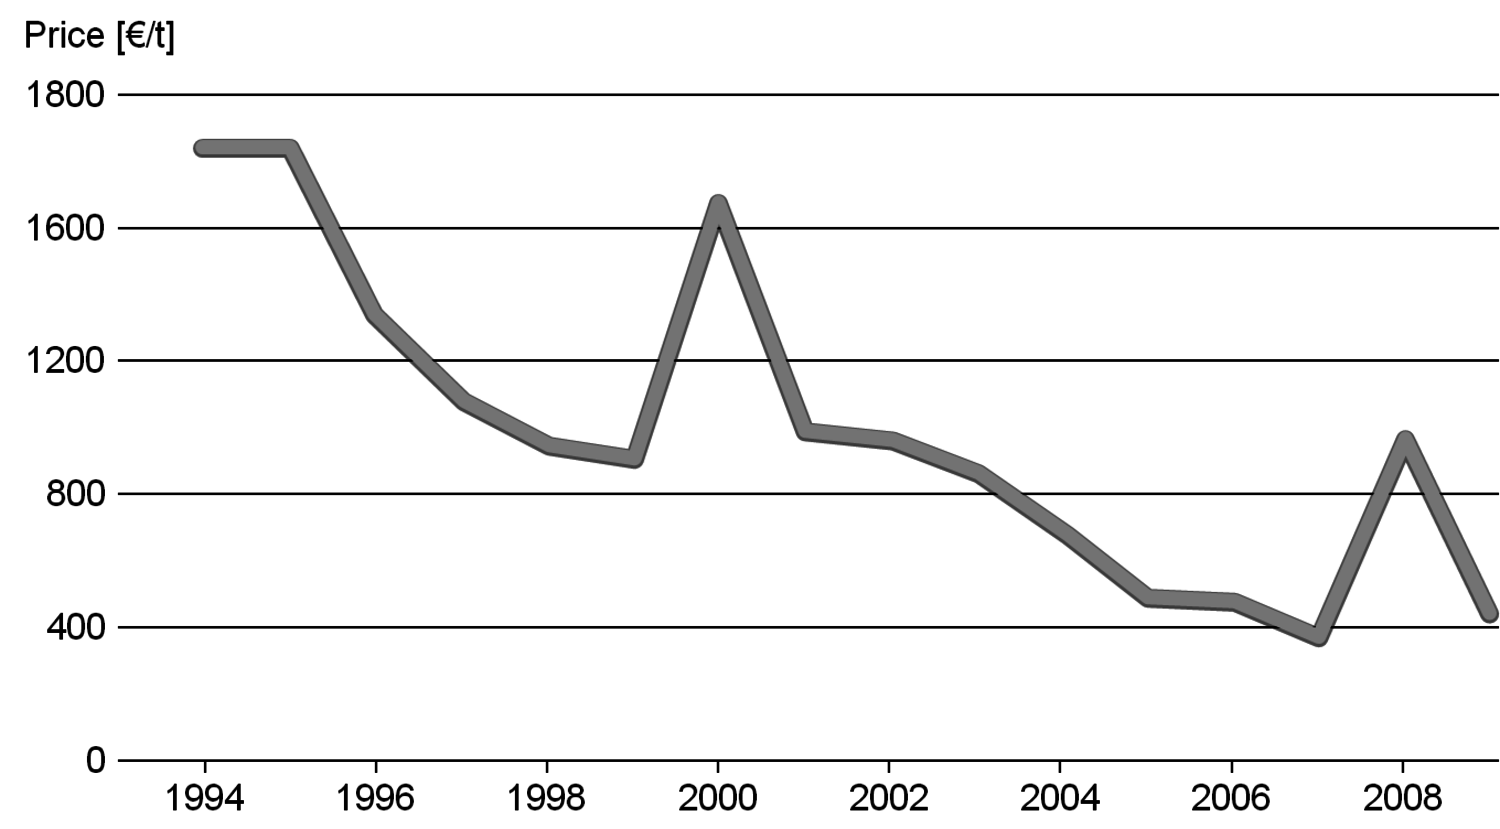
Fig. 1.17: Glycerol Price Decline
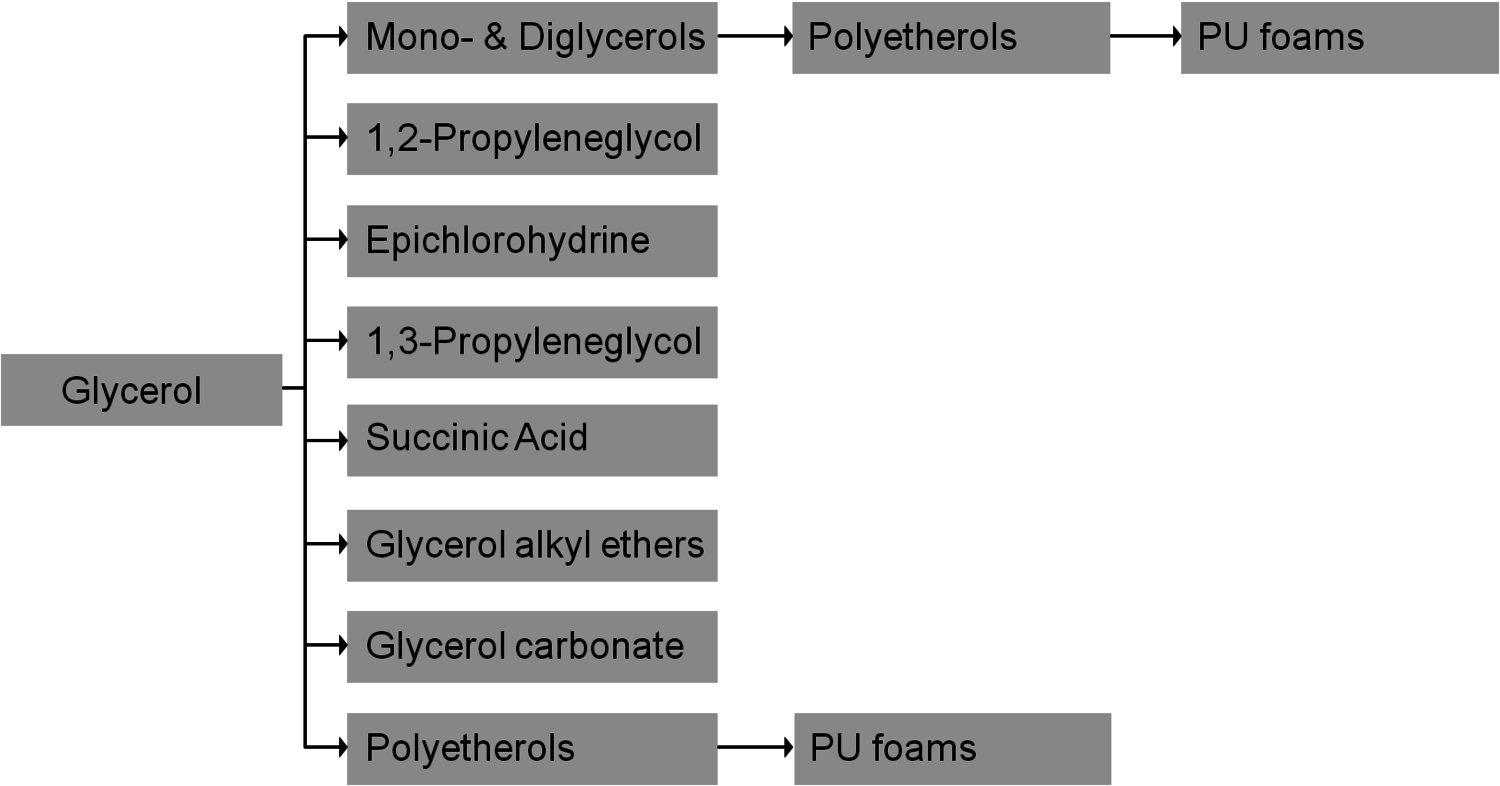
Fig. 1.18: Chemical Value-Added Chains: Glycerol
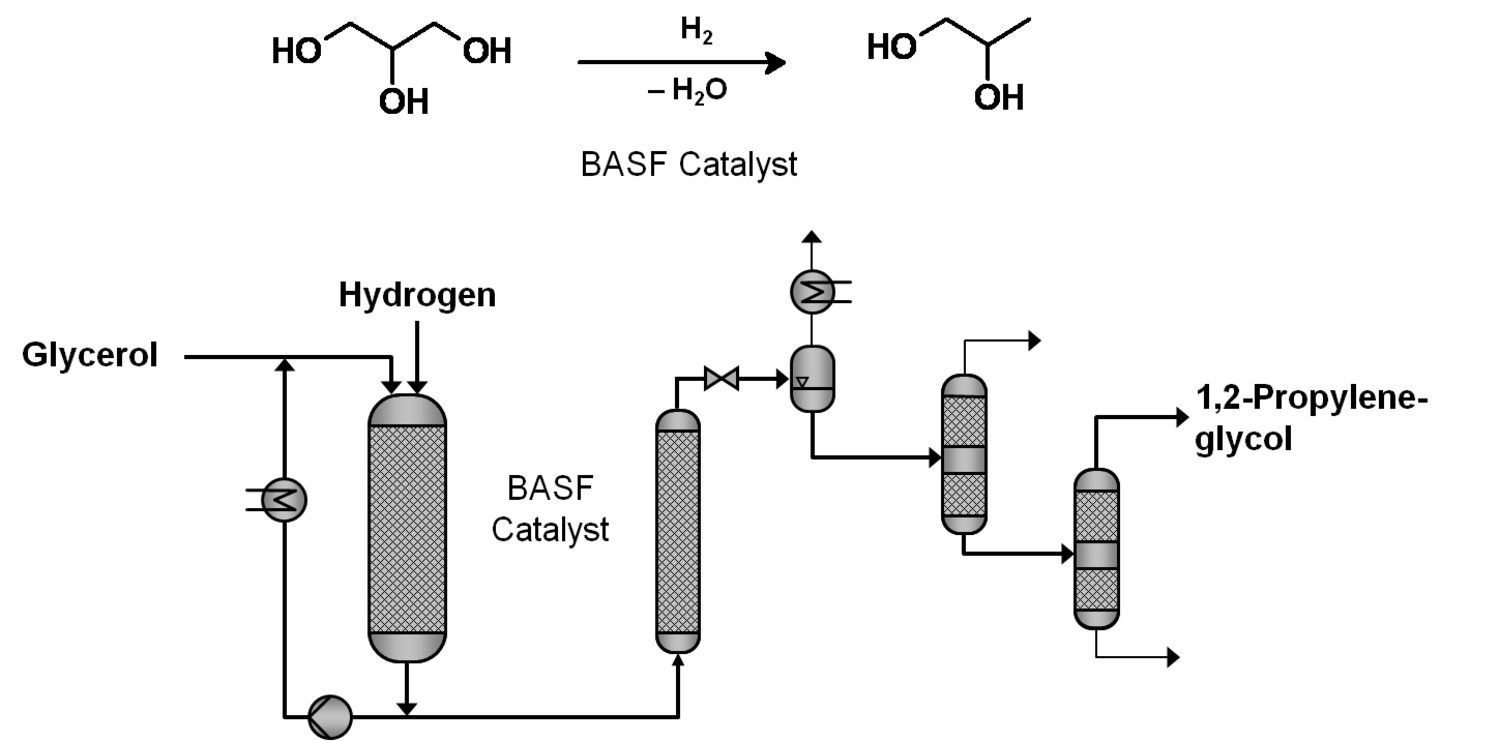
Fig. 1.19: 1,2-Propylene-Glycol from Glycerol
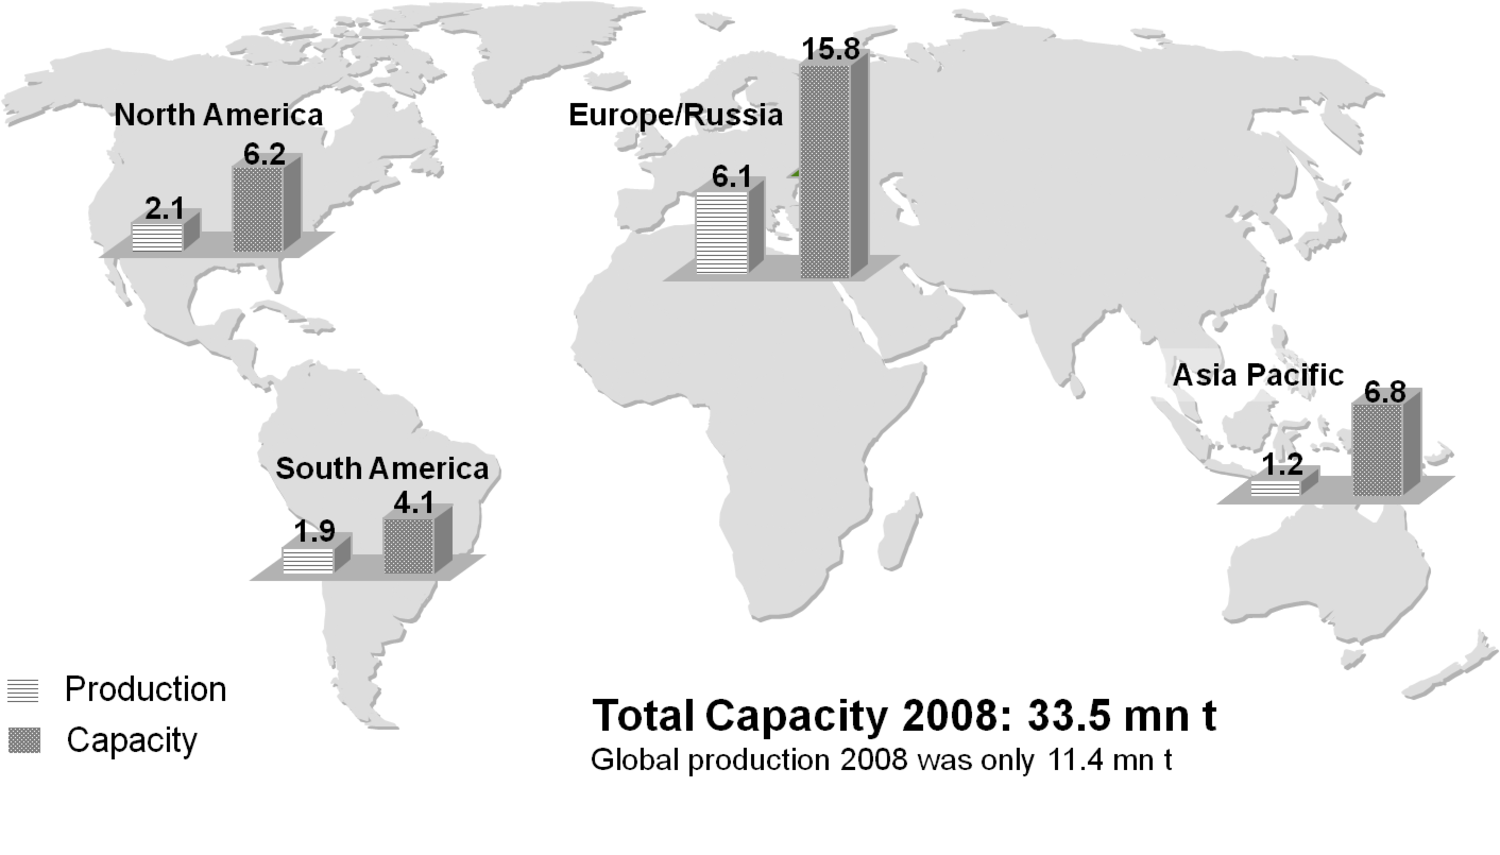
Fig. 1.20: Biodiesel First Generation: Production and Capacities
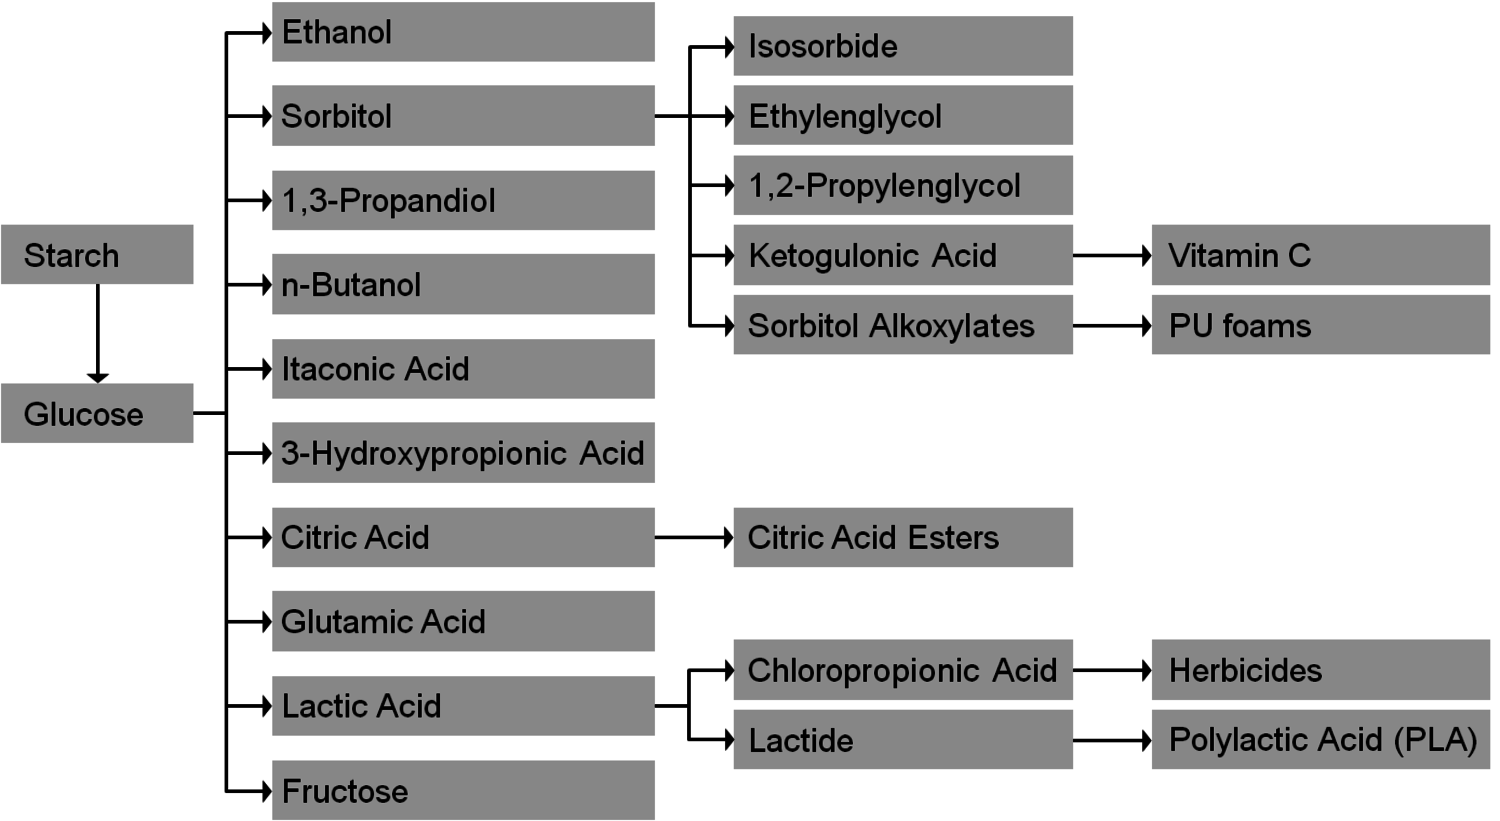
Fig. 1.21: Chemical Value-Added Chains: Starch/Glucose
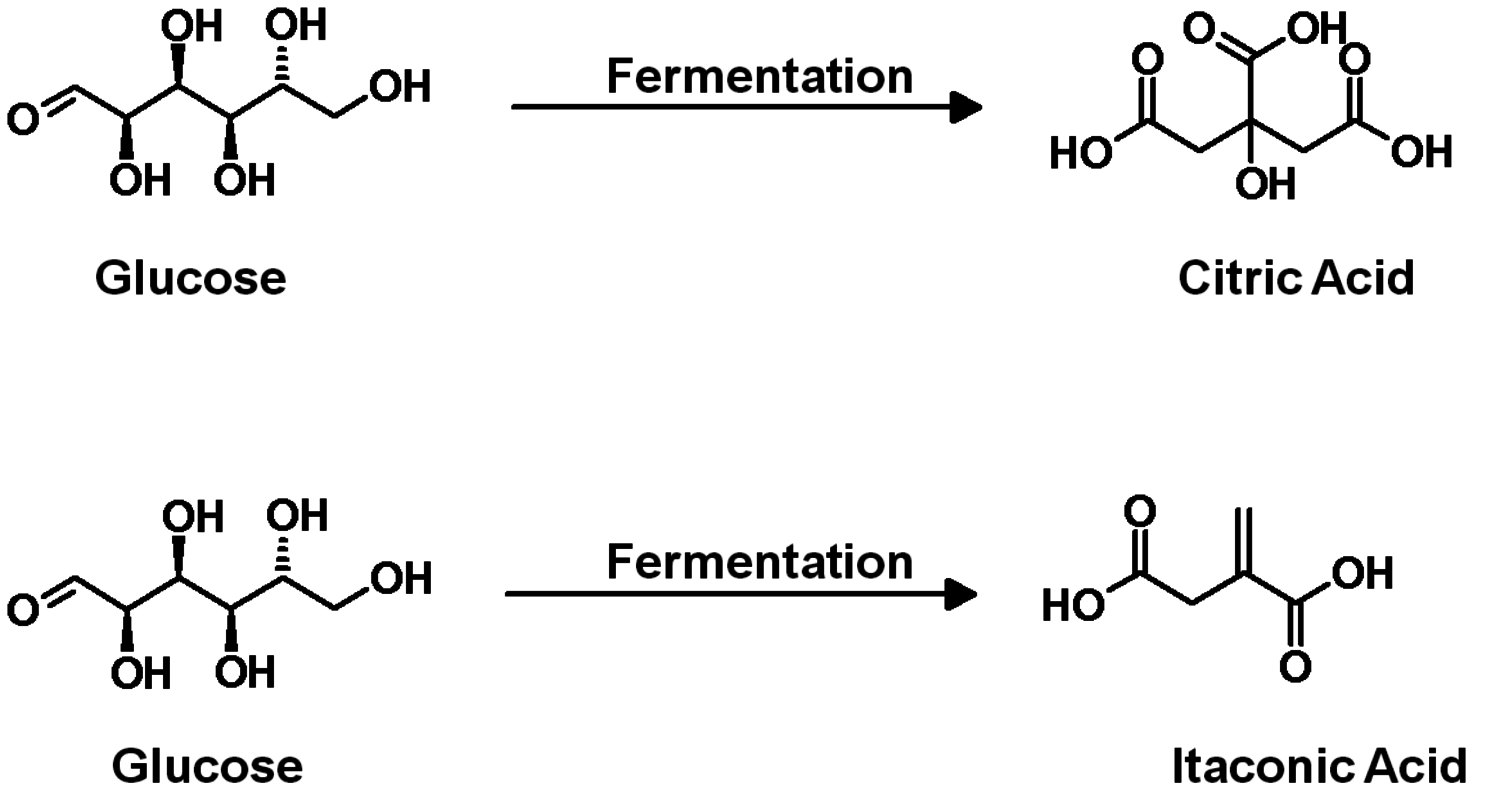
Fig. 1.22: Examples of the Use of Glucose
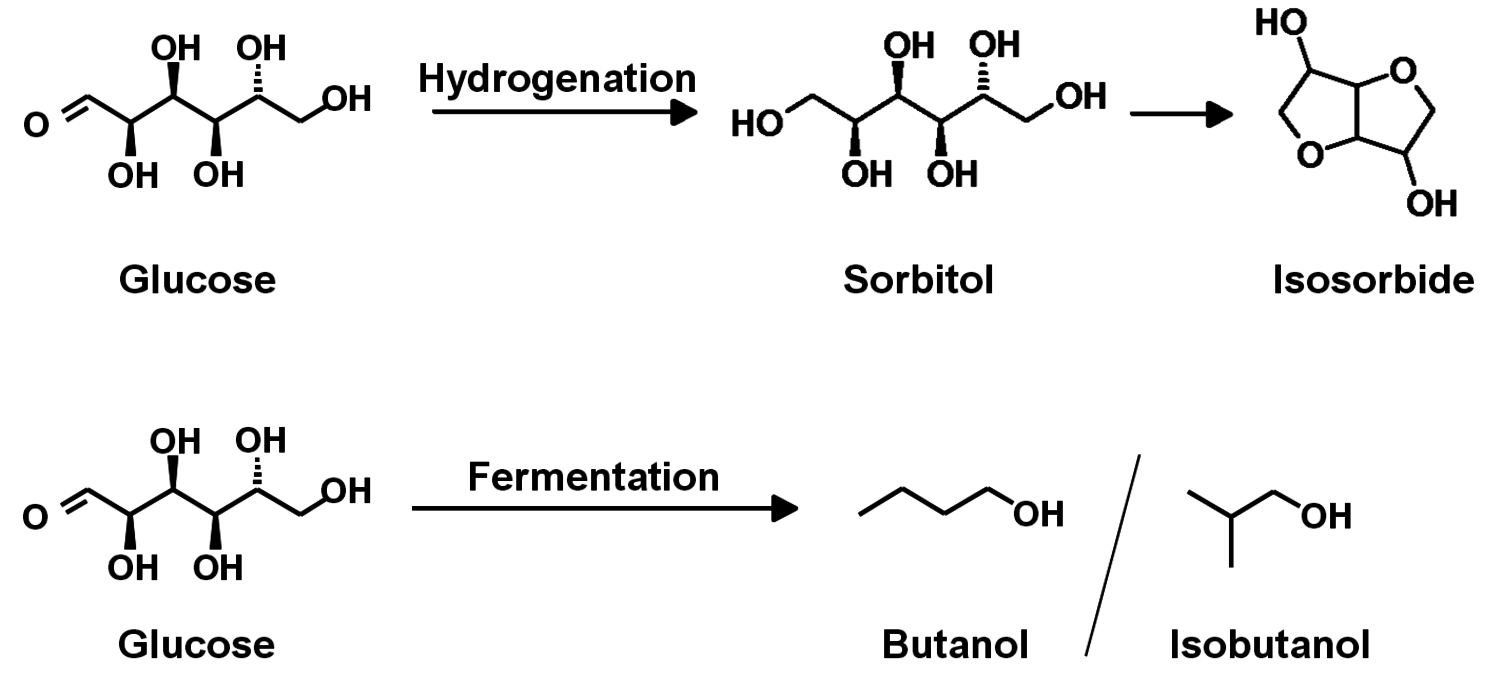
Fig. 1.23: Examples of the Use of Glucose
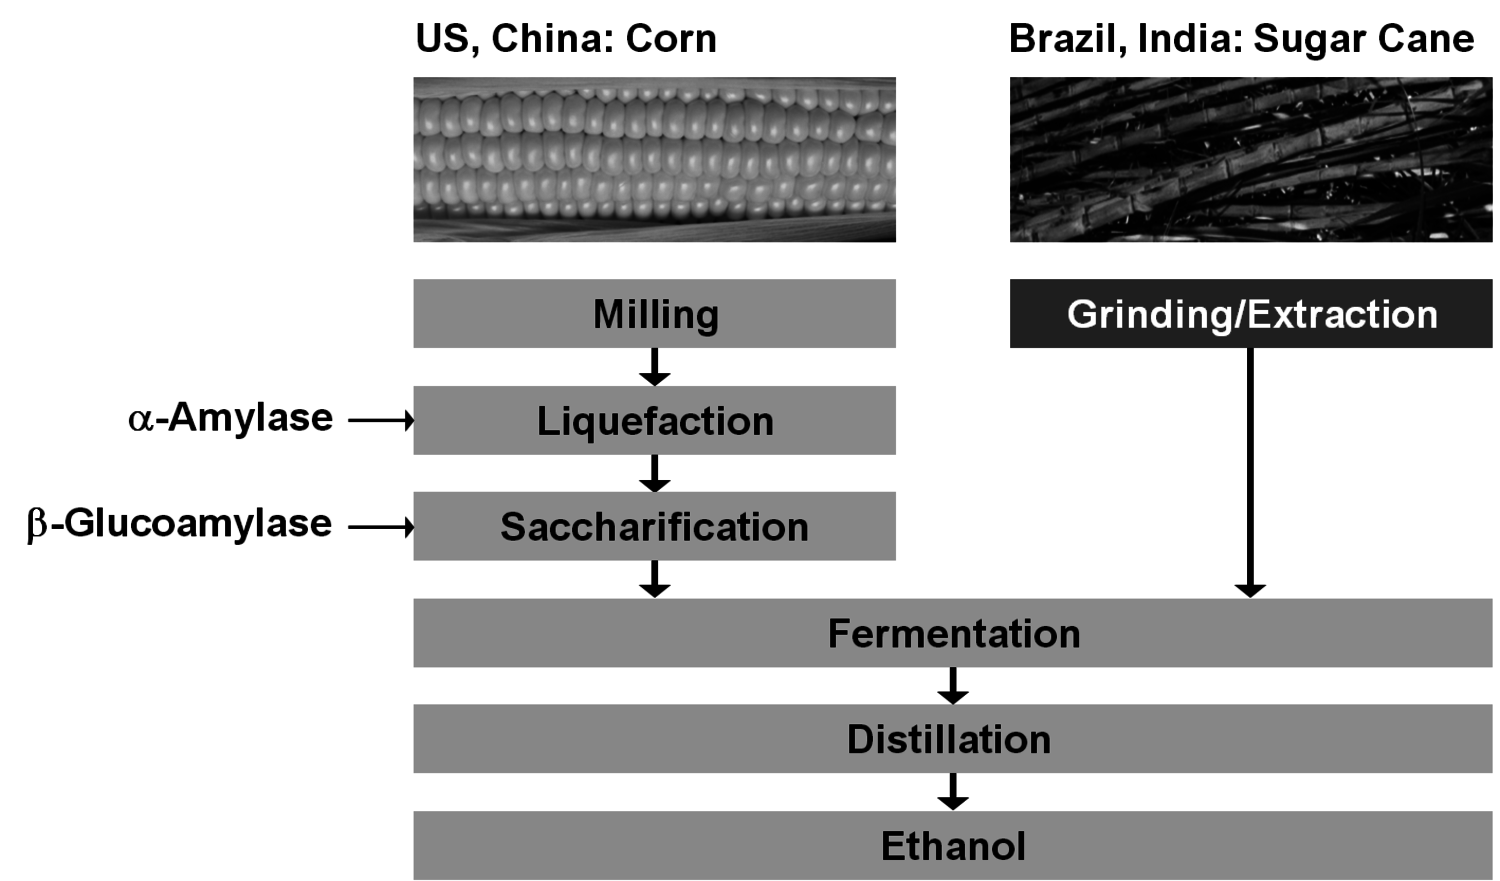
Fig. 1.24: Bioethanol from Starch or Sugar
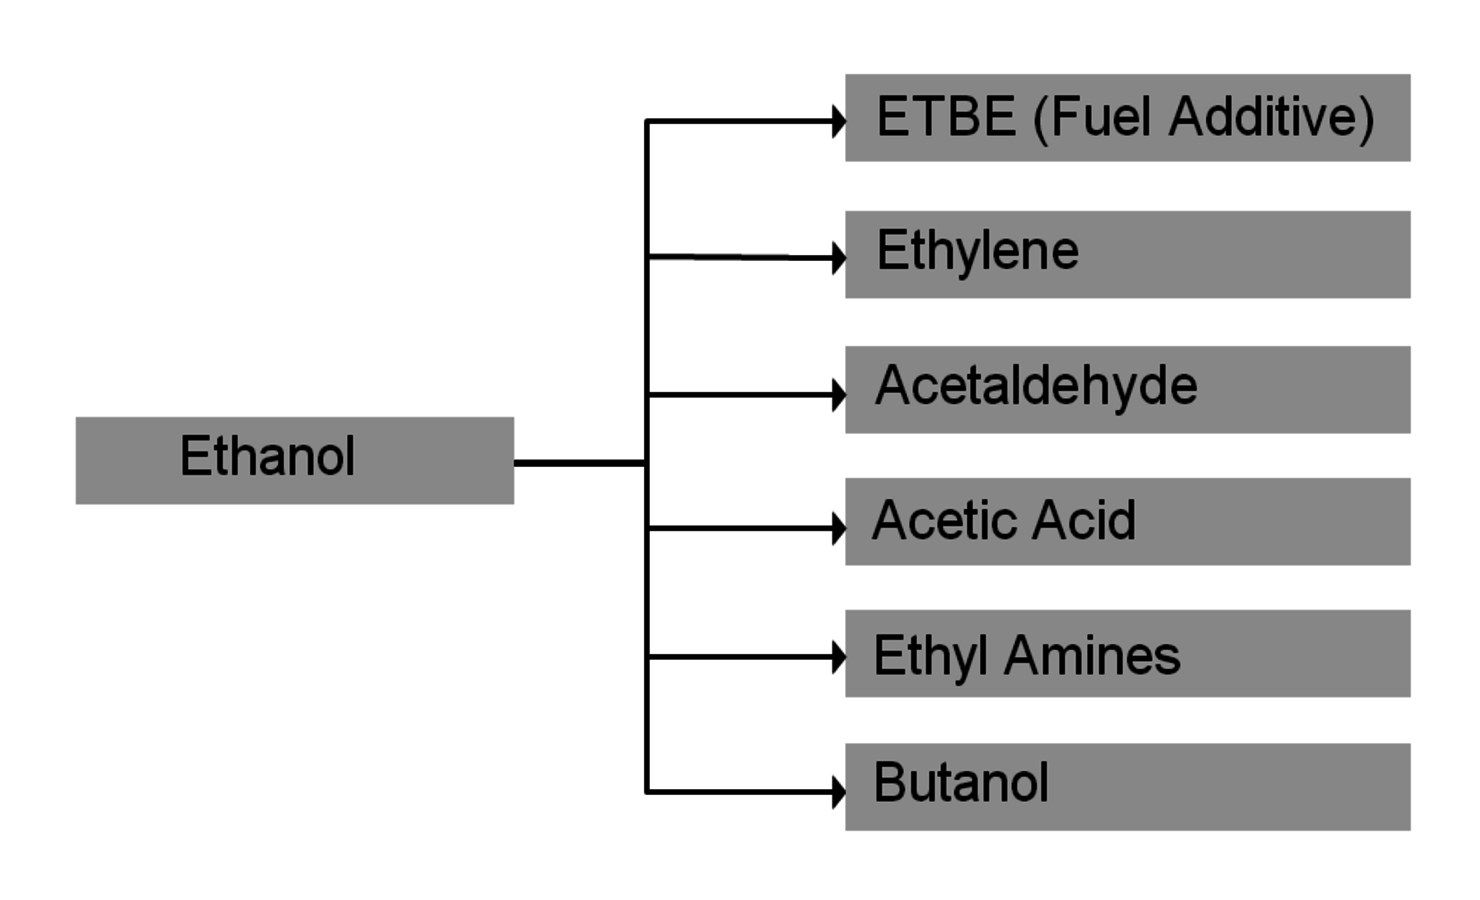
Fig. 1.25: Chemical Value-Added Chains: Ethanol
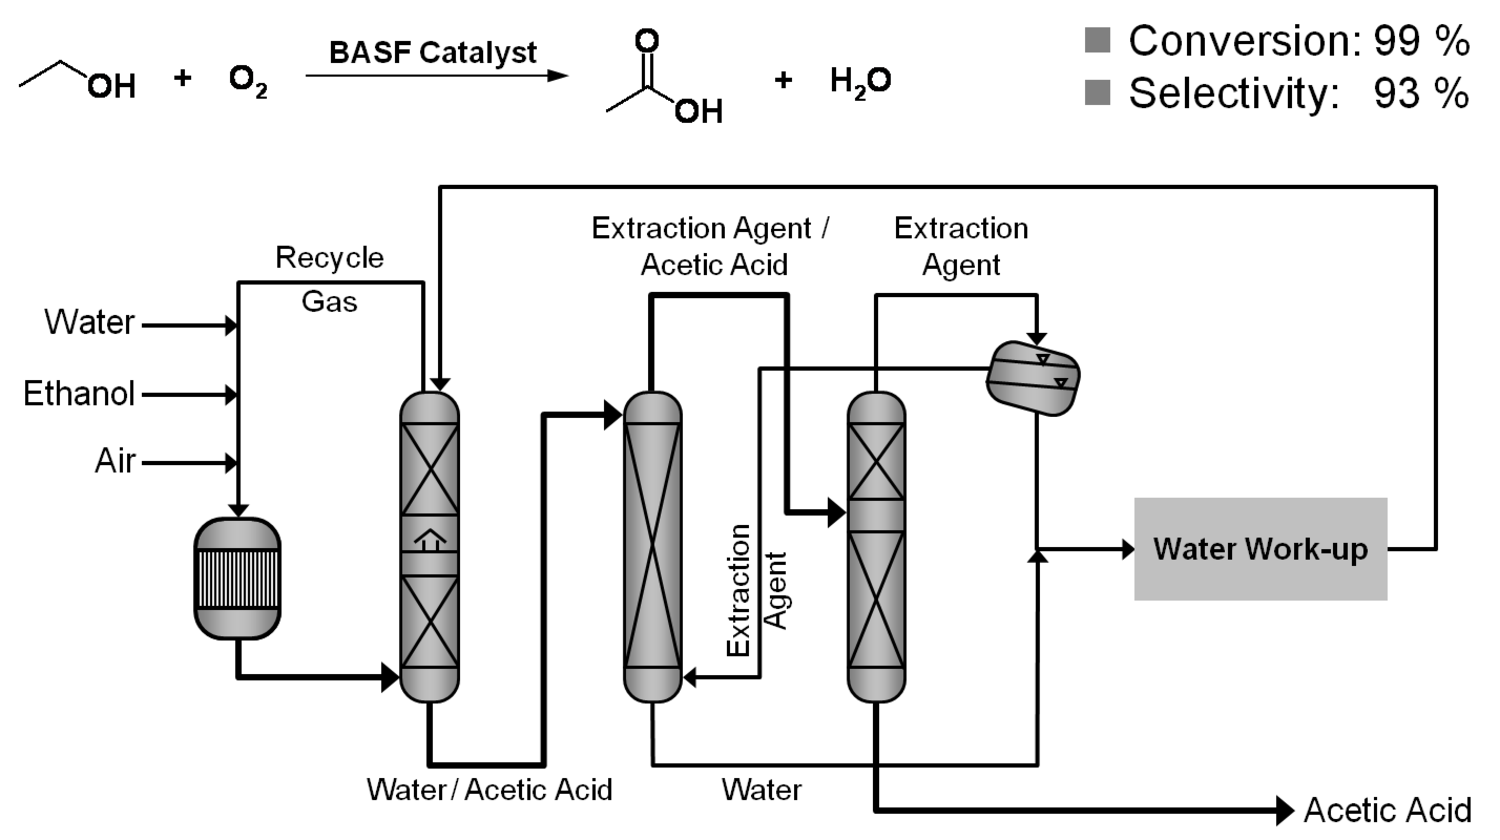
Fig. 1.26: Acetic Acid from Ethanol
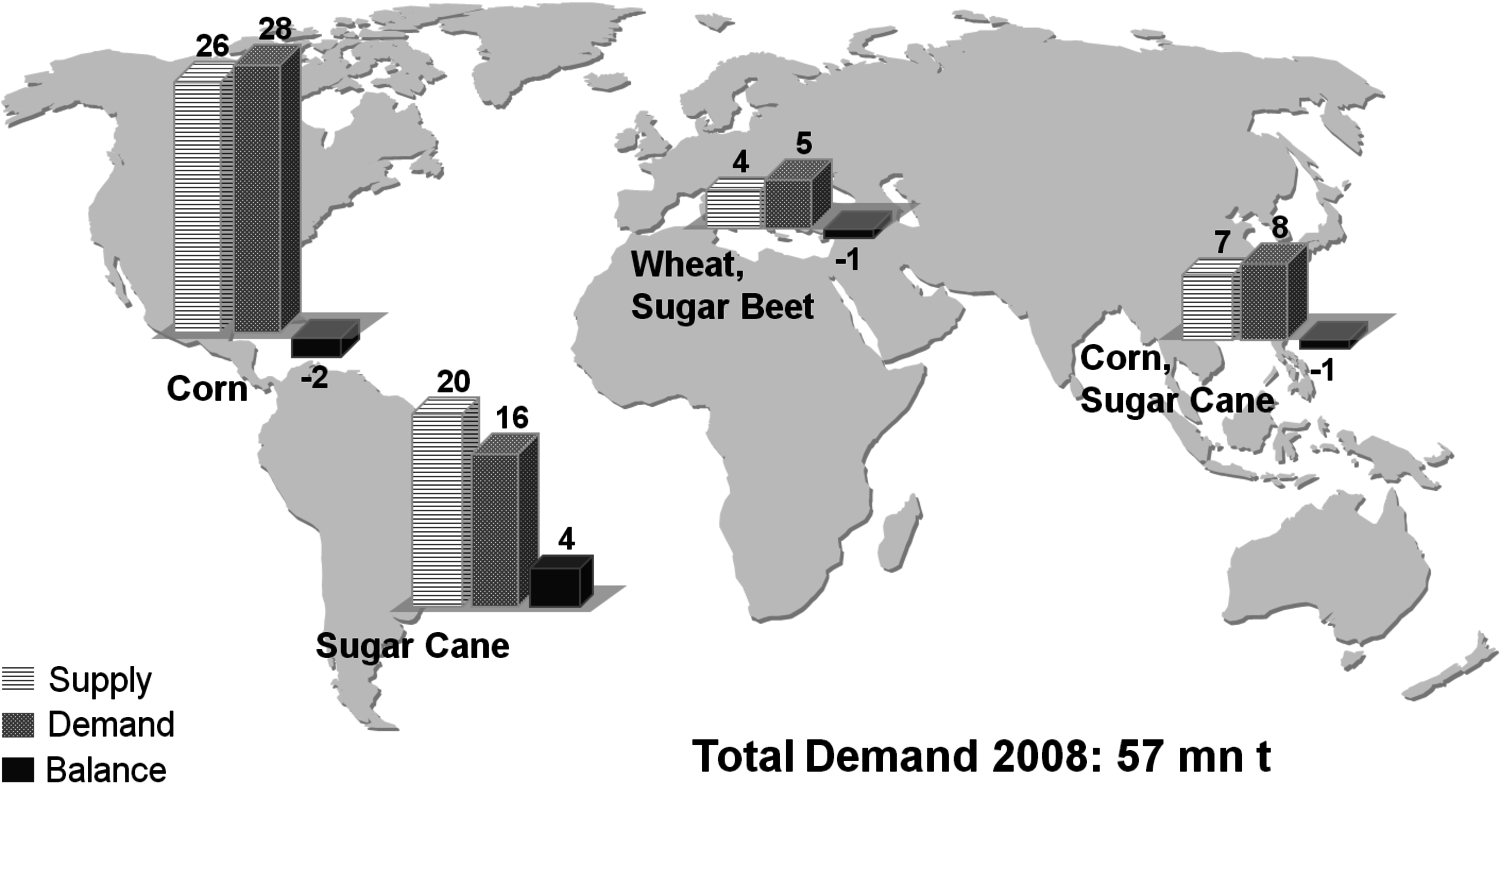
Fig. 1.27: Ethanol: Supply and Demand
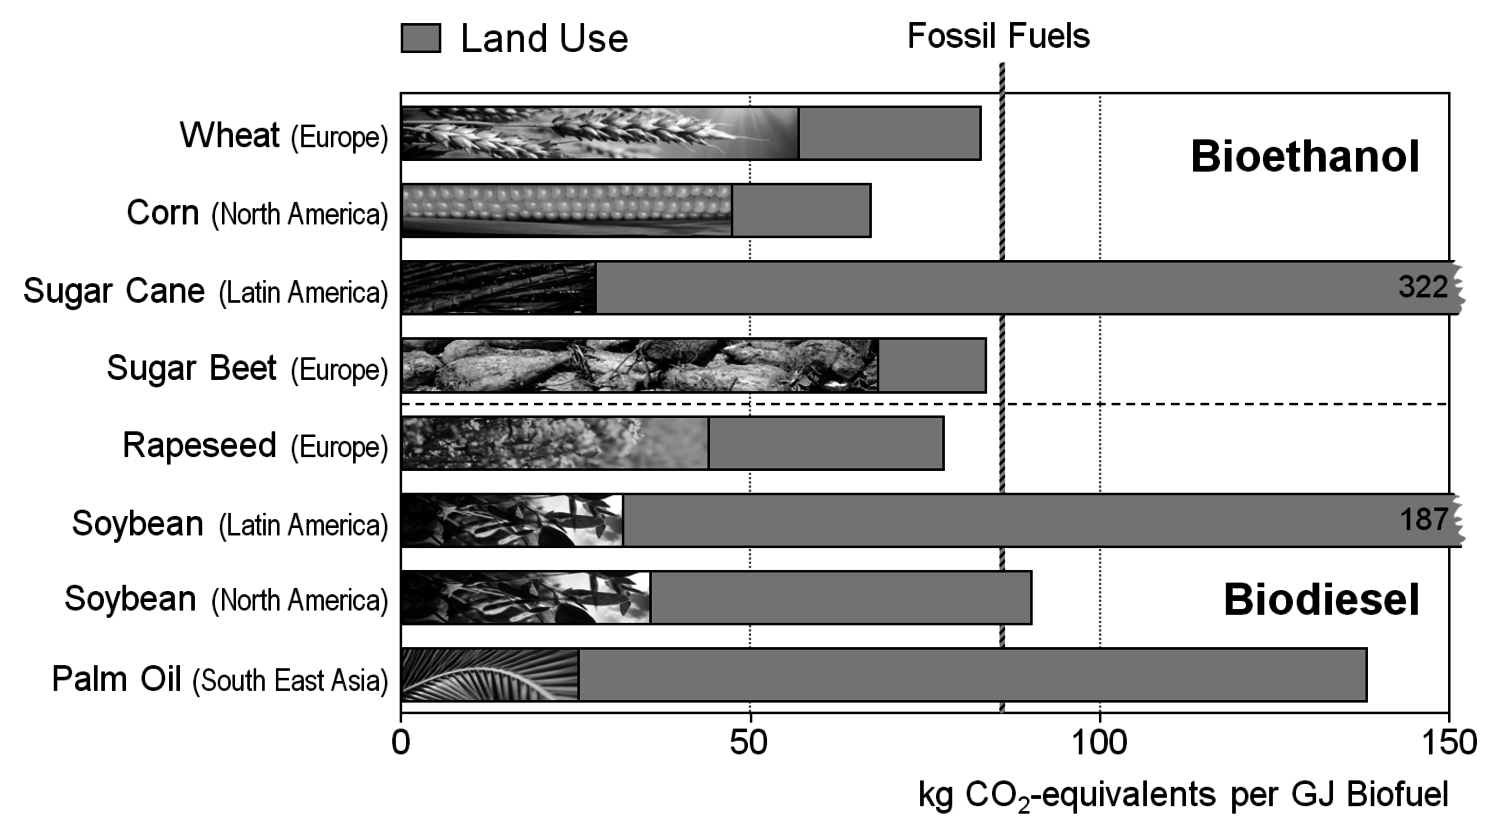
Fig. 1.28: Greenhouse Gas Emissions of Biofuels
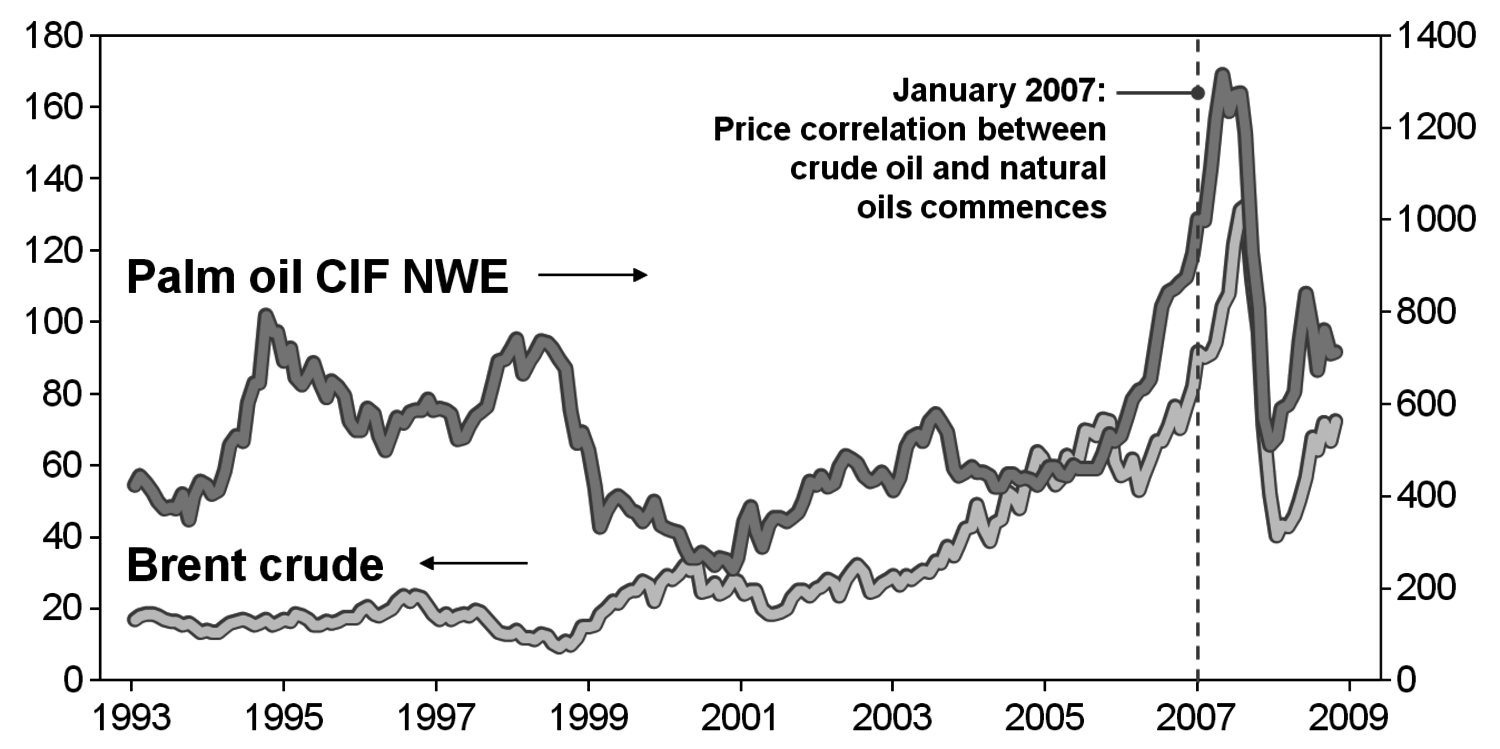
Fig. 1.29: Example: Coupling of Food and Energy Prices (in U.S.$)
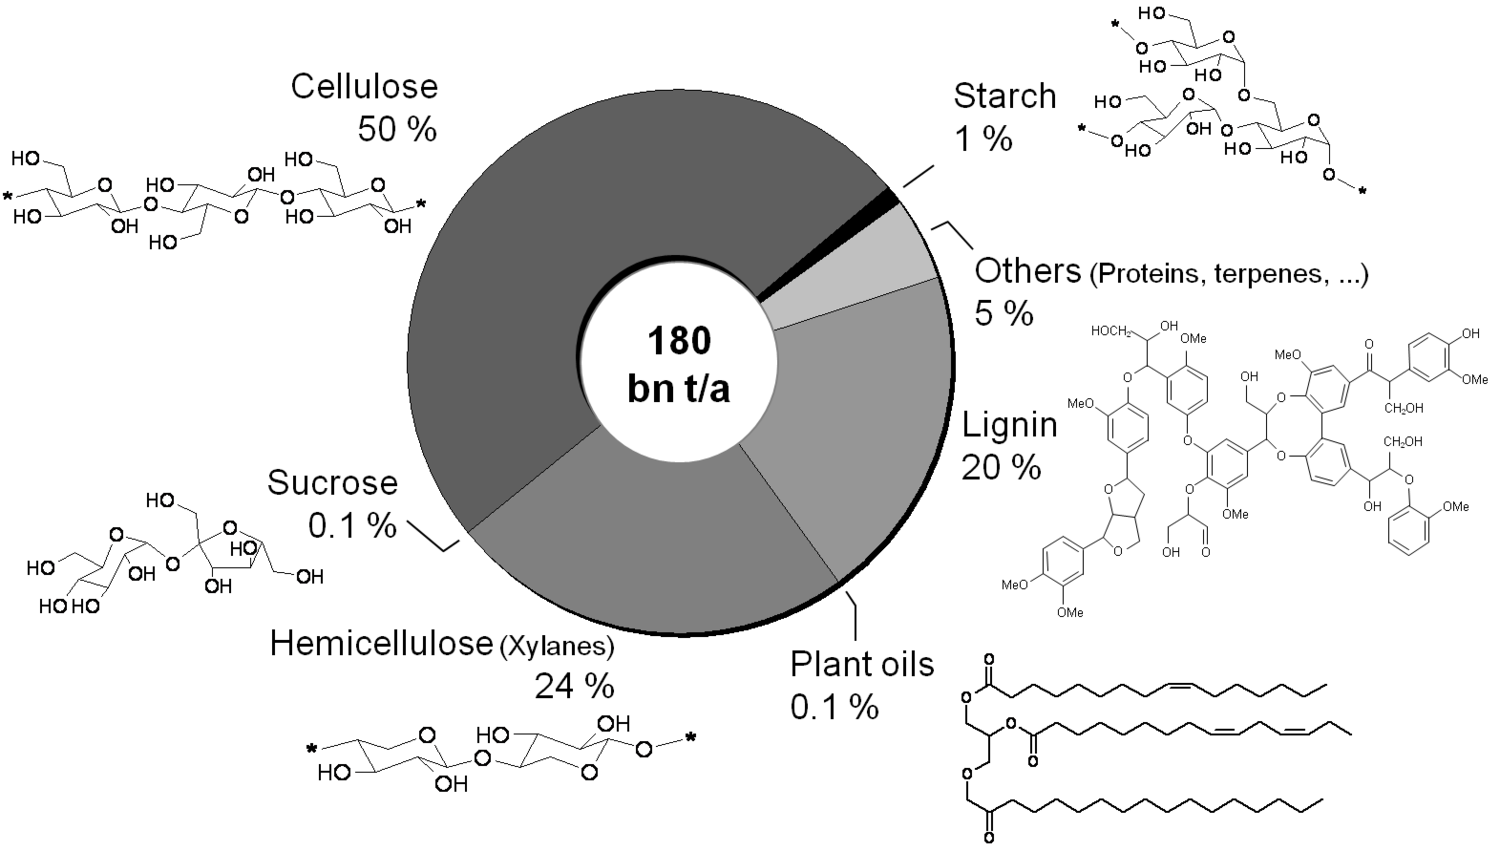
Fig. 1.30: Composition of Biomass
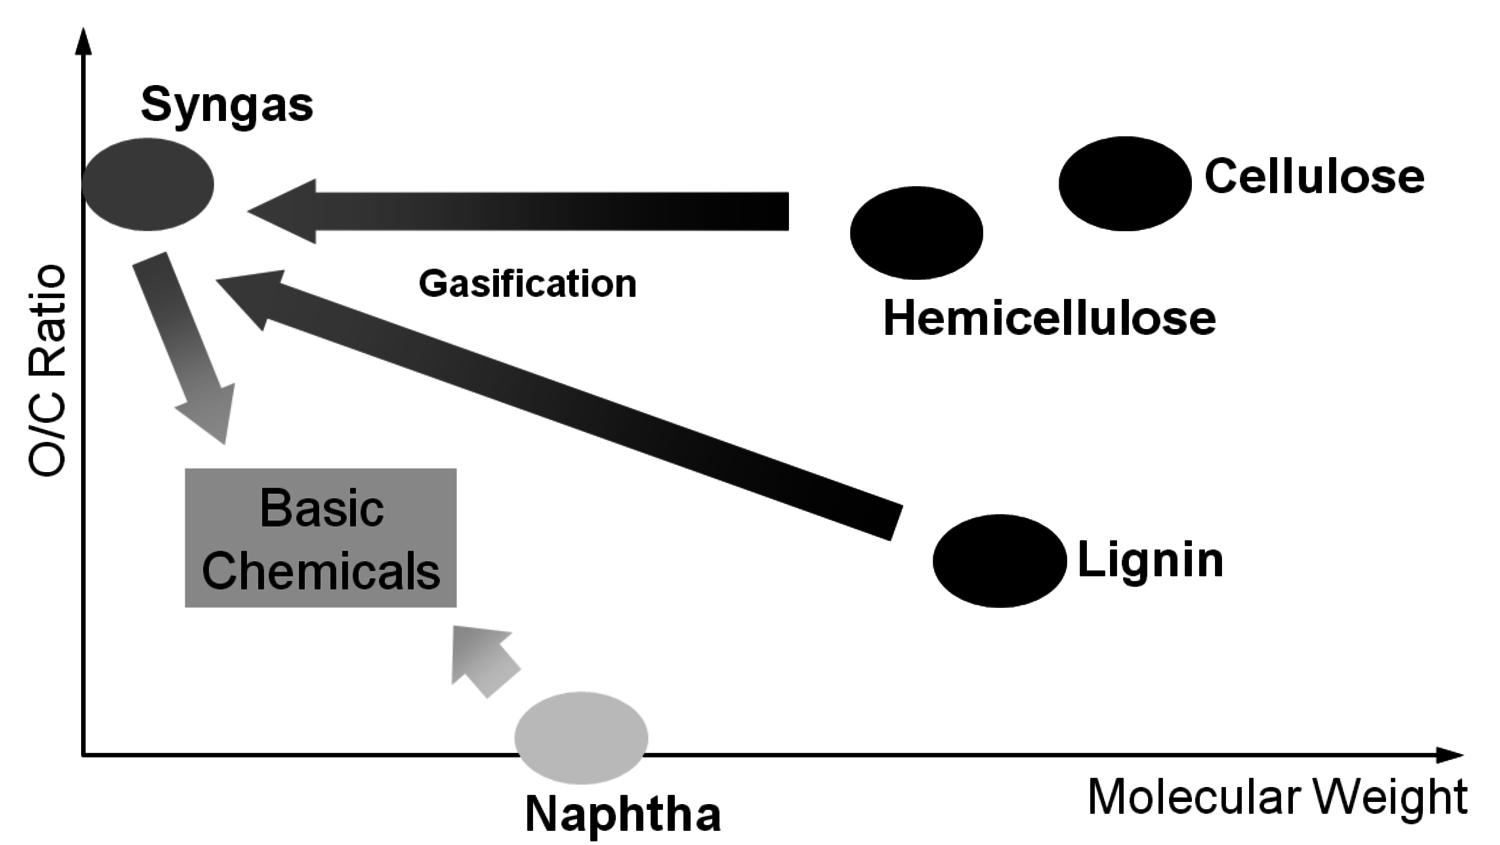
Fig. 1.31: Chemical Modification: Gasification
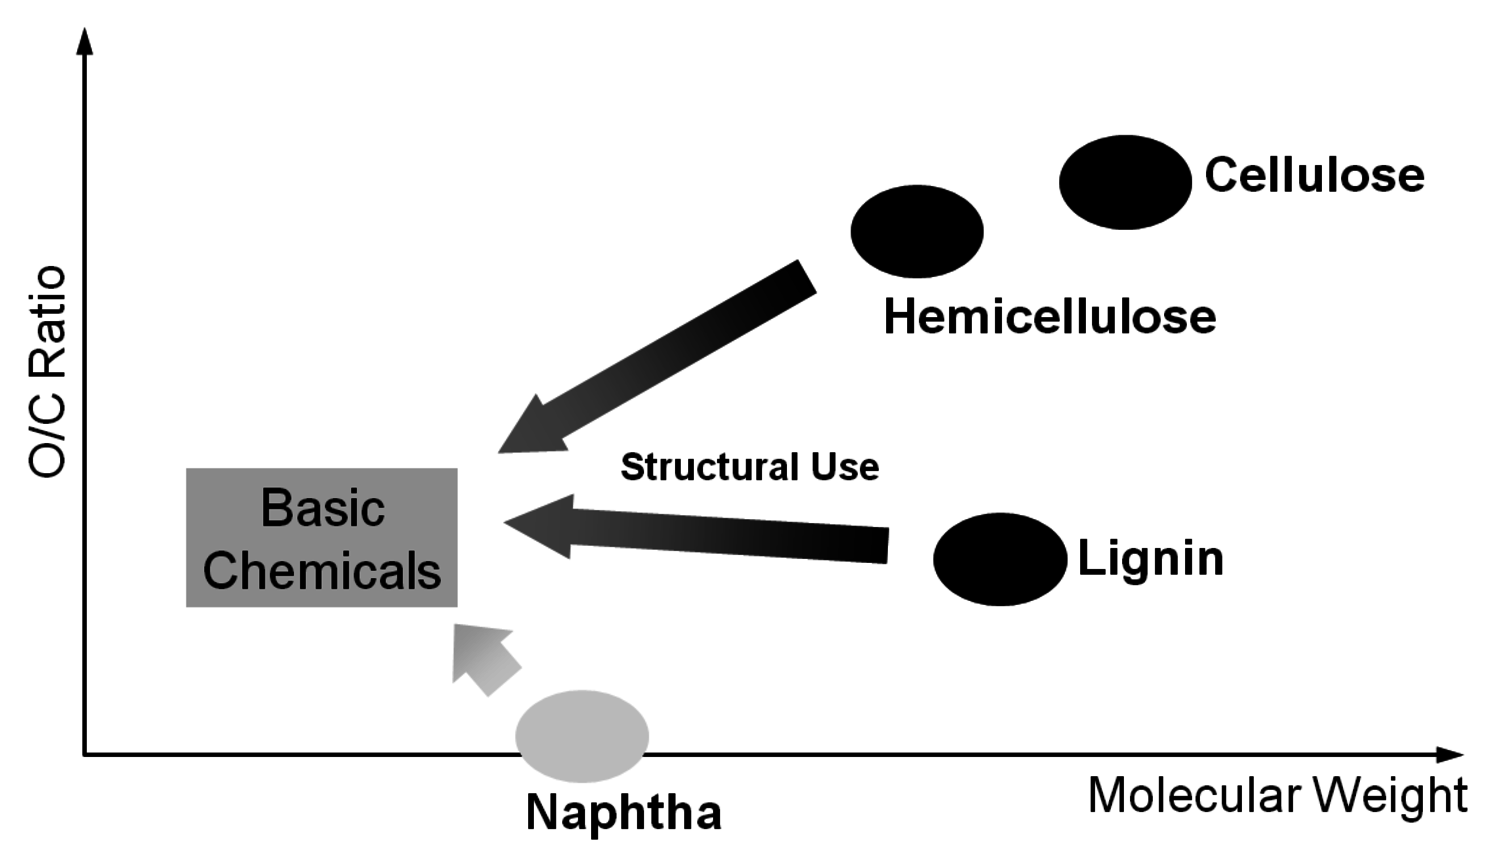
Fig. 1.32: Chemical Modification: Structural Use
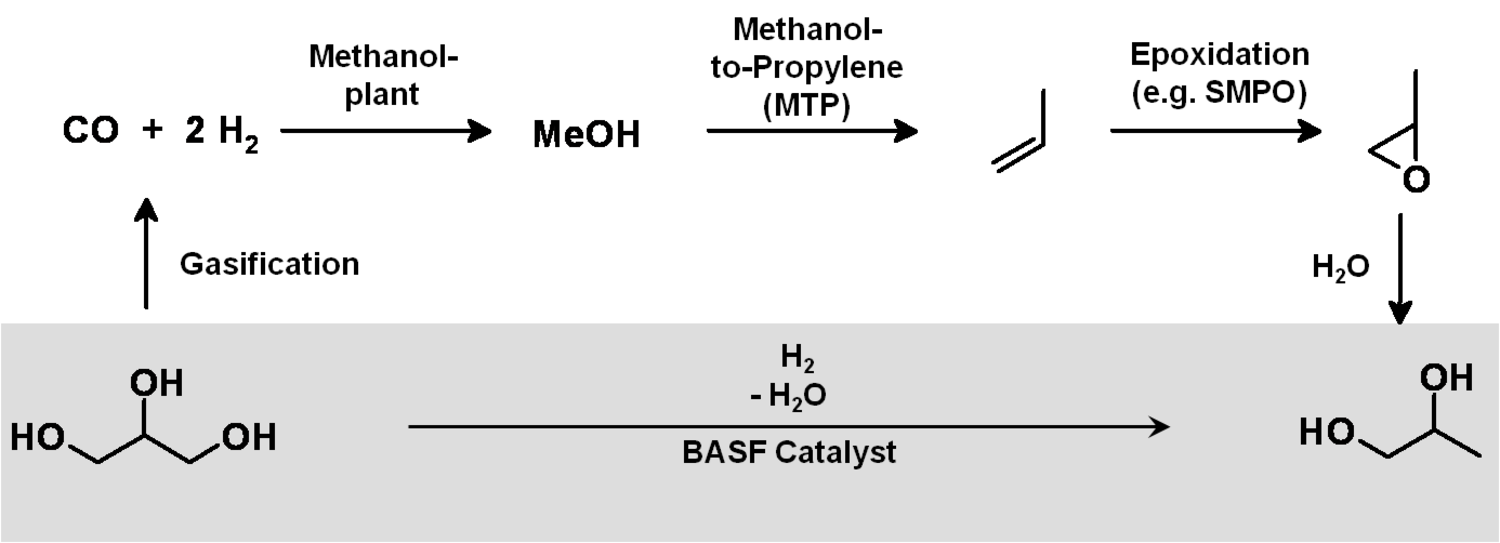
Fig. 1.33: Example: Structural Use versus Gasification
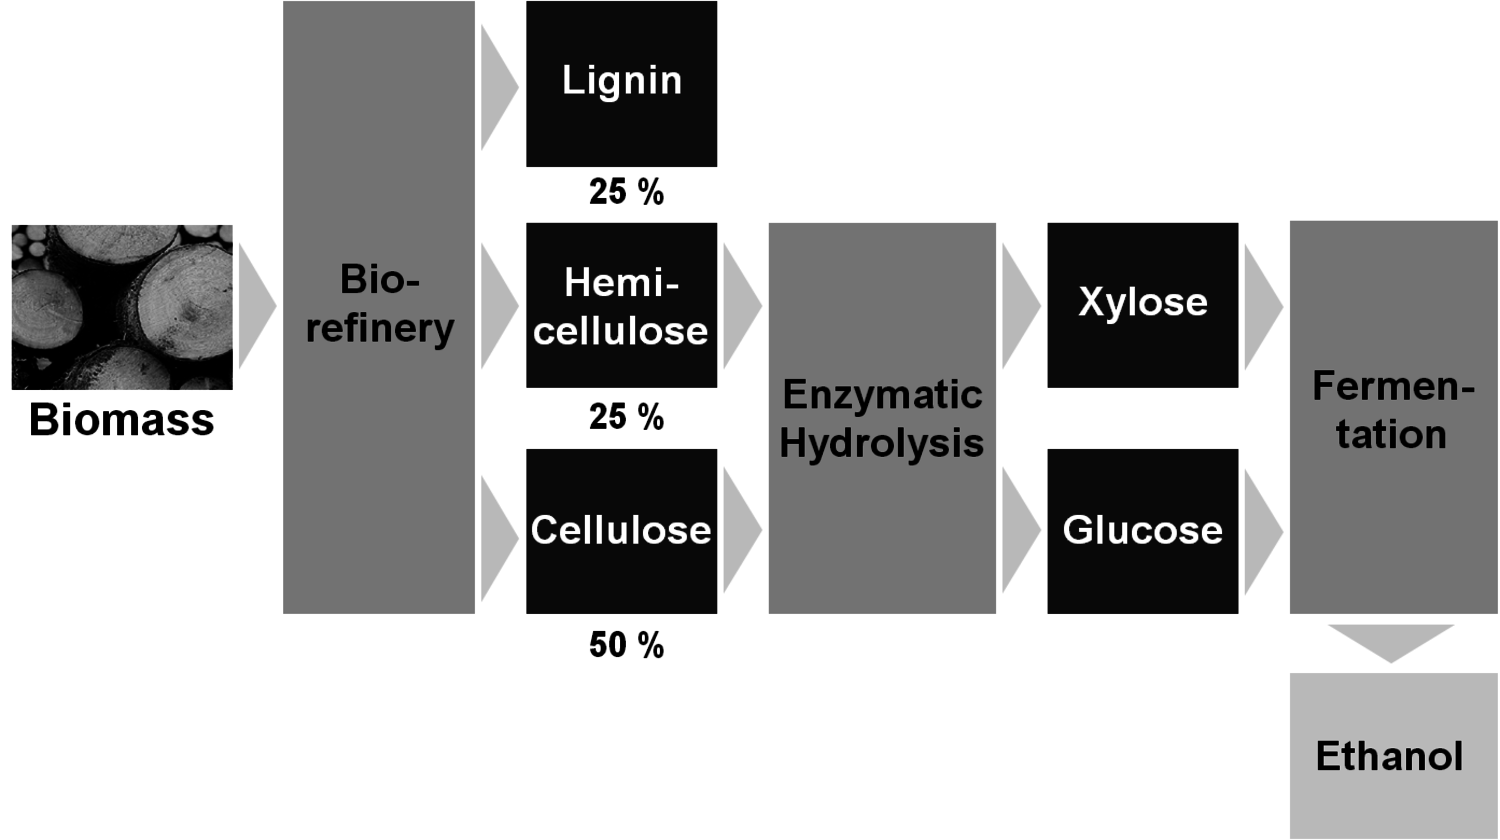
Fig. 1.34: Concept of a Biorefinery
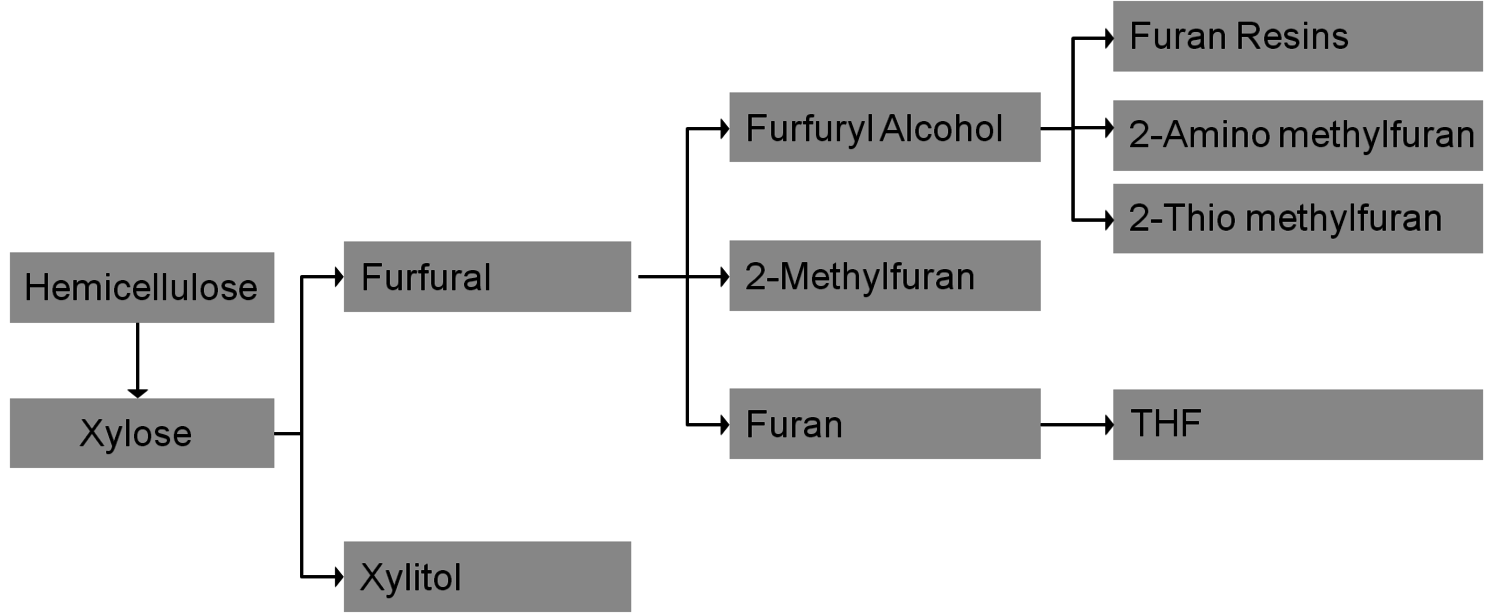
Fig. 1.35: Chemical value-added Chains: Xylose
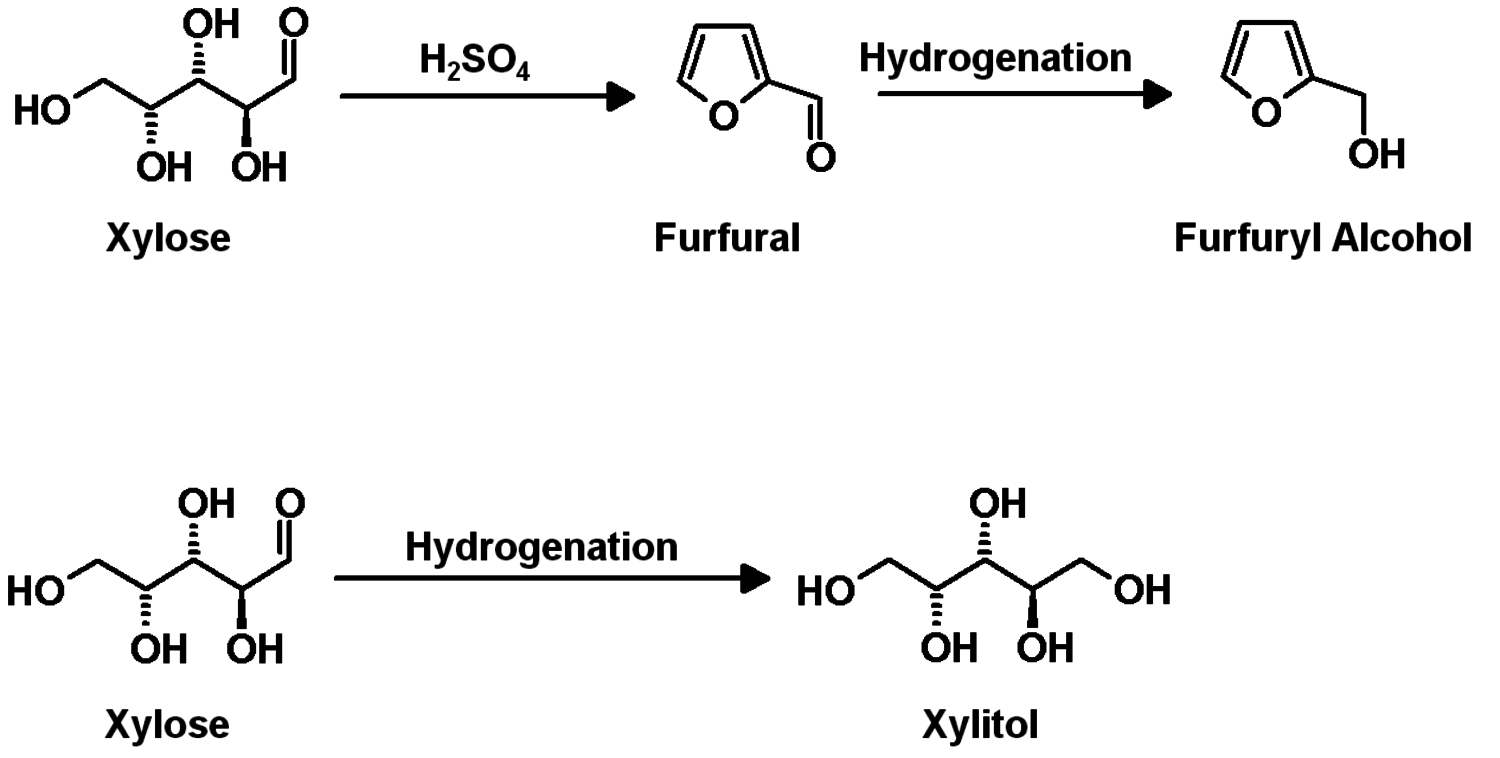
Fig. 1.36: Examples of the Use of Xylose
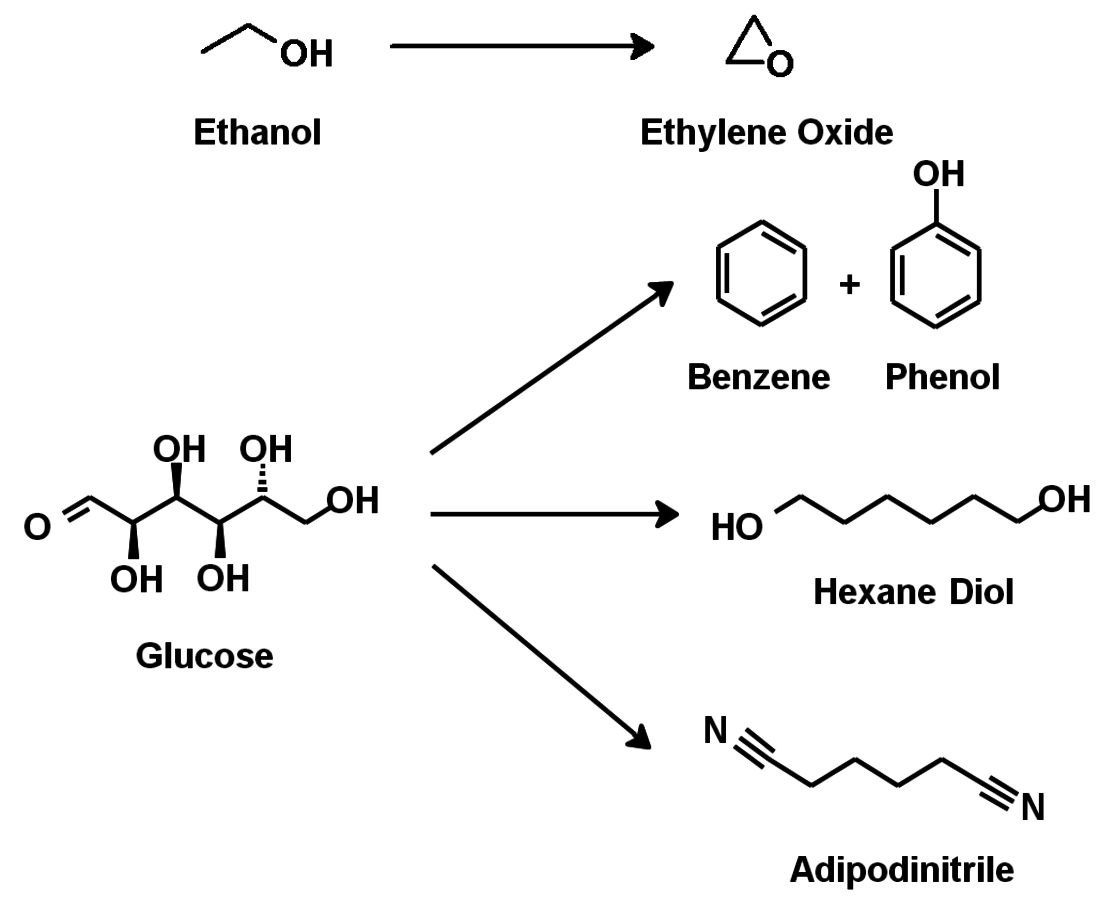
Fig. 1.37: Dream Reactions
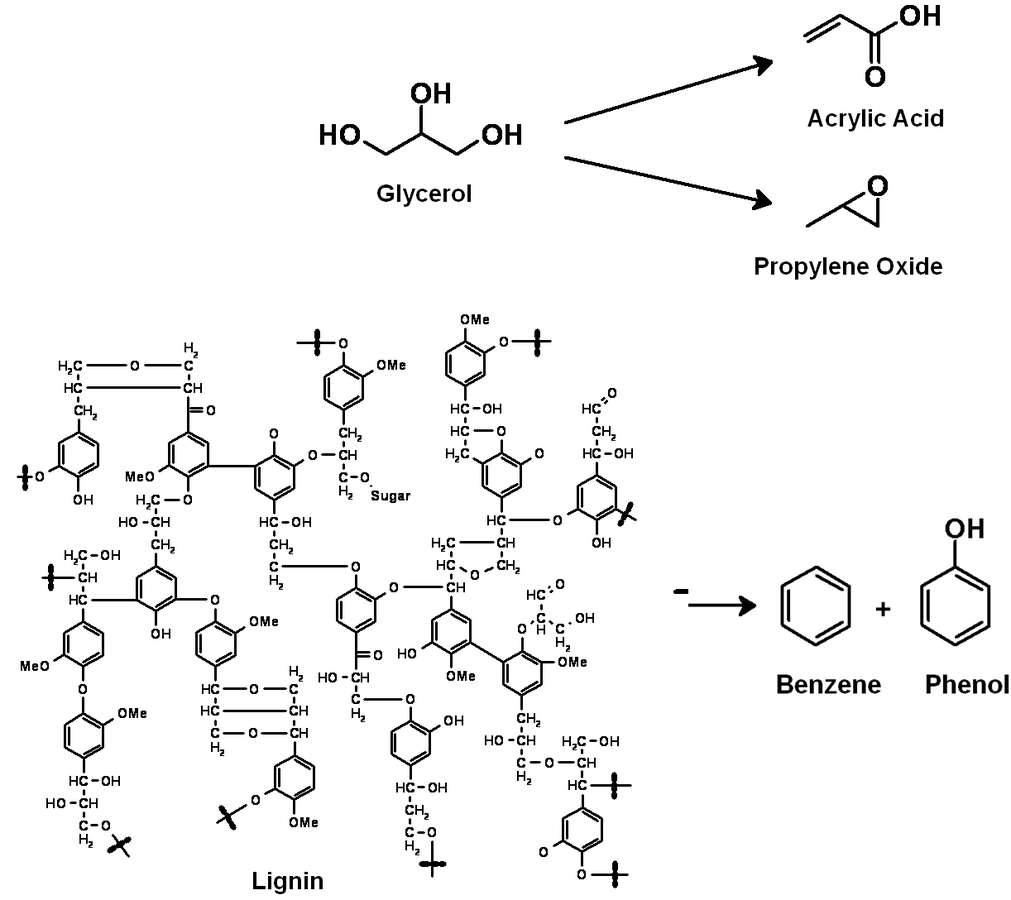
Fig. 1.38: Dream Reactions